

Question: Please help figure out the formulas for the items highlighted in yellow and blue. Not sure if the formula is correct for present value, not
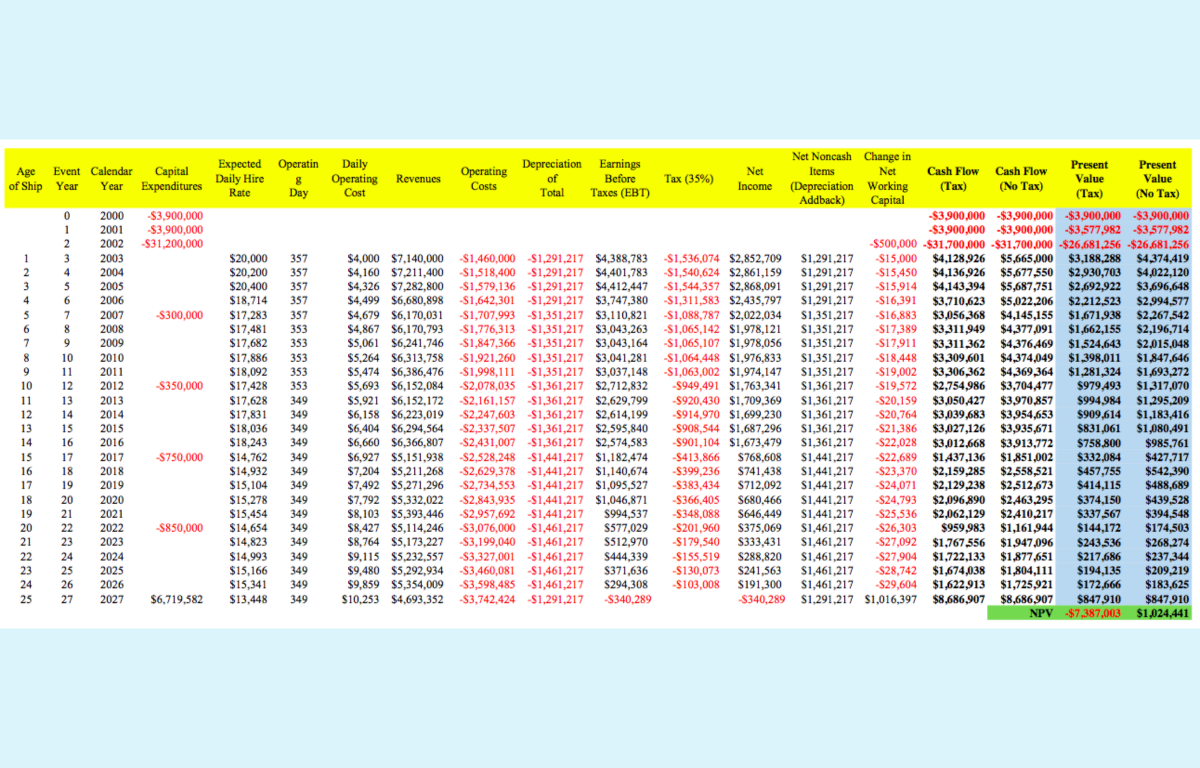
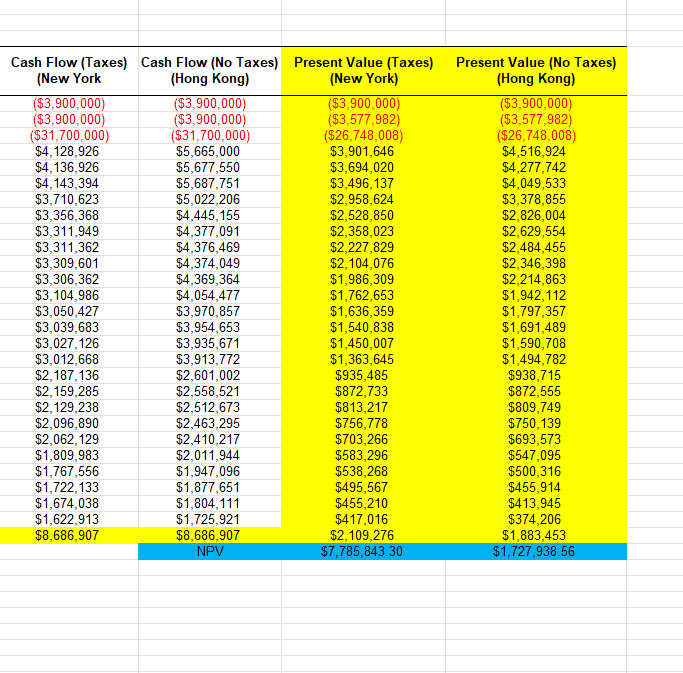
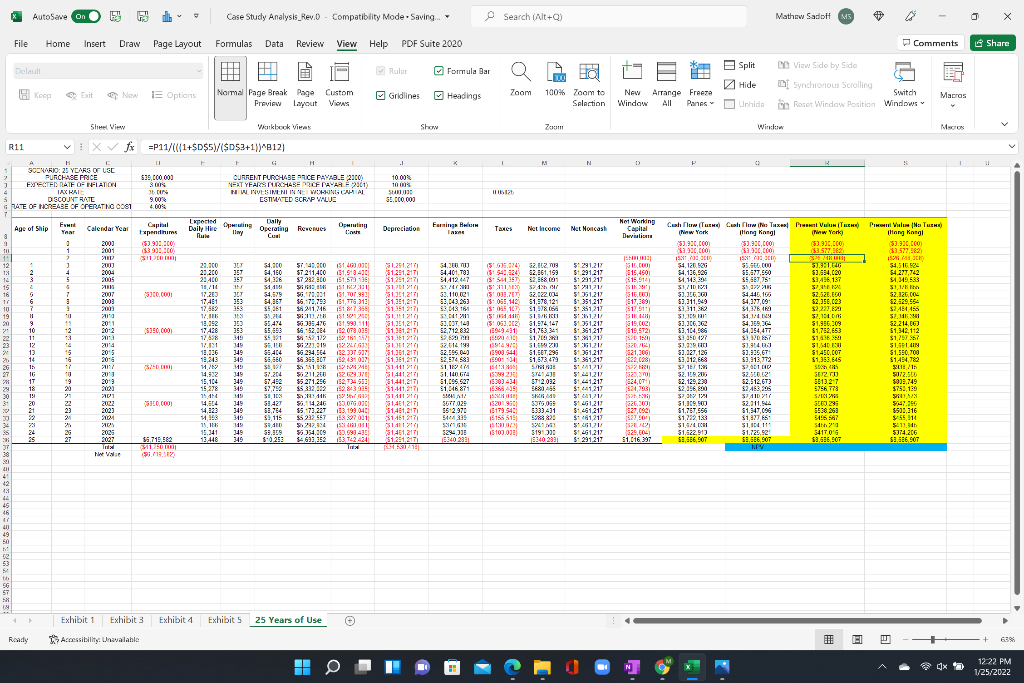
Please help figure out the formulas for the items highlighted in yellow and blue. Not sure if the formula is correct for present value, not sure how to calculate NPV and note sure how to calculate $,8,686,907.
Age Event Calendar Capital of Ship Year Year Expenditures 1 2 3 4 5 6 7 8 9 10 11 12 13 14 15 16 17 18 19 20 21 22 23 24 25 0 0 1 2 3 3 4 5 5 6 7 8 9 10 11 12 13 14 15 16 17 18 19 20 21 22 23 24 25 26 27 2000 -$ -$3,900,000 2001 $3,900,000 2002 $31,200,000 2003 2004 2005 2006 2007 -$300,000 2008 2009 2010 2011 2012 -S350,000 2013 2014 2015 2016 2017 $750,000 2018 2019 2020 2021 2022 -S850,000 2023 2024 2025 2026 2027 $6,719.582 Expected Operatin Daily Net Noncash Change in Depreciation Earnings Operating Daily Hire Present 8 Net Present 8 Net Before of Operating Revenues Items Cash Flow Cash Flow Tax (35%) Costs Value Value Rate Day Cost Total ) Income (Depreciation Working Taxes (EBT) (Tax) (No Tax) Addback) Capital (Tax) (No Tax) -$3,900,000 $3,900,000 $3,900,000 $3,900,000 -$3,900,000 $3,900,000 $3,577,982 -$3,577,982 -$500,000 - $31.700,000-$31,700,000 -$26.681,256 -$26,681,256 $20,000 357 $4,000 $7,140,000 $1,460,000 $1,291,217 $4,388,783 $1,536,074 $2,852,709 $1,291,217 $15,000 $4,128,926 $5,665,000 $3,188,288 $4,374.419 $20,200 357 $4,160 $7,211,400 $1,518,400 $1,291,217 $4,401,783 $1,540,624 $2,861,159 S1,291,217 -S15,450 $4,136,926 $5,677,550 $2,930,703 $4,022,120 $20,400 357 $4,326 $7,282,800 $1,579,136 -$1,291,217 $4,412,447 $1,544,357 $2,868,091 $1,291,217 -S15,914 $4,143,394 $5,687,751 $2,692,922 $3,696,648 $18,714 357 $4,499 $6,680,898 $1,642,301 $1,291,217 $3,747,380 $1,311,583 $2,435,797 $1,291,217 -S16,391 $3,710,623 $5,022,206 $2.212,523 $2.994,577 $17.283 357 $4,679 $6,170,031 -S1,707,993 $1,351,217 $3,110,821 -S1,088,787 $2,022,034 $1,351,217 -S16,883 $3,056,368 $4,145,155 $1,671,938 $2,267,542 $ $ $17,481 353 $4,867 $6,170,793 -S1,776,313 -$1,351,217 $3,043,263 -$1,065,142 $1,978,121 S1,351,217 -$17,389 $3,311,949 $4,377,091 $1,662,155 $2,196,714 $17.682 353 $5,061 $6,241,746 $1,847,366 $1,351,217 $3,043,164 $1,065,107 $1,978,056 $1,351,217 -$17,911 $3,311,362 $4,376,469 $1,524,643 $2.015.048 $17.886 353 $5,264 $6,313,758 $1,921,260 $1,351,217 $3,041,281 $1,064,448 $1,976,833 $1,351,217 -S18,448 $3,309,601 $4,374,049 $1,398,011 $1,847,646 $18,092 353 $5,474 $6,386,476 -$1,998,111 $1,351,217 $3,037,148 $1,063,002 $1,974,147 $1,351,217 -$19,002 $3,306,362 $4,369,364 $1,281,324 $1,693,272 $17,428 353 $5,693 $6,152,084 $2,078,035 -$1,361,217 $2,712,832 -$949,491 $1,763,341 $1,361,217 $19,572 $2,754,986 $3,704,477 $979,493 $1,317,070 $17,628 349 $5,921 $6,152,172 $2,161,157 $1,361,217 $2,629,799 -$920,430 $1,709,369 $1,361,217 -$20,159 $3,050 427 $3.970,857 $994,984 $1,295,209 $ $17,831 349 $6,158 $6,223,019 $2,247,603 $1,361,217 $2,614,199 -$914,970 $1,699,230 S1,361,217 -$20,764 $3,039,683 $3,954,653 $909,614 $1,183,416 $18,036 349 $6,404 $6,294,564 -$2,337,507 $1,361,217 $2,595,840 -$908,544 $1,687,296 S1,361,217 -$21,386 $3,027,126 $3,935,671 $831,061 $1,080,491 $18,243 349 $6,660 $6,366,807 $2,431,007 $1,361,217 $2,574,583 -$901,104 $1,673,479 S1,361,217 S22,028 $3,012,668 $3,913,772 $758.800 $985,761 $14,762 349 $6,927 $5,151,938 $2,528,248 $1,441,217 $1,182,474 -S413,866 S768,608 $1,441,217 -$22,689 $1,437,136 $1,437,136 $1,851,002 $332,084 $427,717 $14.932 349 $7,204 $5,211,268 S2,629,378 $1,441,217 $1,140,674 $399,236 $741,438 $1,441,217 -$23,370 $2,159,285 $2,558,521 $457,755 $542,390 $15,104 349 $7,492 $5,271,296 $2,734,553 $1,441,217 $1,095,527 $ -$383,434 $712,092 $1,441,217 $24,071 $2,129,238 $2,512,673 $414,115 $488,689 $15,278 349 $7,792 $5,332,022 $2,843,935 $1,441,217 $1,046,871 - -$366,405 S680,466 $1,441.217 -$24,793 $2,096,890 $2,463,295 $374.150 $439,528 $15.454 349 $8,103 $5,393.446 -S2,957,692 $1,441,217 S994,537 -$348,088 S646,449 $1,441,217 -$25,536 $2,062,129 $2,410,217 $337567 $394,548 $14,654 349 $8,427 $5,114,246 -$3,076,000 $1,461,217 $577,029 -S201.960 $375,069 $1,461,217 -$26,303 $959,983 $1,161,944 $144.172 $174,503 $14,823 349 $8,764 $5,173,227 -$3,199,040 $1,461,217 $512,970 -$179,540 $333,431 S1,461,217 -$27,092 $1,767,556 $1,947,096 $243,536 $268.274 $14.993 349 $9,115 $5,232,557 $3,327,001 -$1,461,217 $444,339 -$155,519 $288,820 $1,461,217 -$27,904 $1,722,133 $1,877,651 $217,686 $237,344 $15,166 349 $9,480 $5,292,934 $3,460,081 $1,461,217 S371,636 -$130,073 S241,568 $1,461,217 S28,742 $1,674,038 $1,804,111 $194.135 $209,219 $15,341 349 $9,859 $5,354,009 $3,598,485 $1,461,217 S294,308 -$103,008 $191,300 $1,461,217 -$29,604 $1,622,913 $1,725,921 $172.666 $183,625 $13,448 349 $10,253 $4,693,352 $3,742,424 $1,291,217 $340,289 $340,289 $1,291,217 $1,016,397 $8,686,907 $8,686,907 $847910 $847910 NPV $7,387,003 $1,024,441 Cash Flow (Taxes) Cash Flow (No Taxes) Present Value (Taxes) (New York (Hong Kong) (New York) ($3,900,000) ($3,900,000) ($3,900,000) ($3,900,000) ($3,900,000) ($3,577,982) ($31,700,000) ($31,700,000) ($26,748,008) $4, 128,926 $5,665,000 $3,901,646 $4, 136,926 $5,677,550 $3,694,020 $4,143,394 $5,687,751 $3,496,137 $3,710,623 $5,022,206 $2,958,624 $3,356,368 $4,445,155 $2,528,850 $3,311,949 $4,377,091 $2,358,023 $3,311,362 $4,376,469 $2,227,829 $3,309,601 $4,374,049 $2,104,076 $3,306,362 $4,369,364 $1,986,309 $3,104,986 $4,054,477 $1,762,653 $3,050,427 $3,970,857 $1,636,359 $3,039,683 $3,954,653 $1,540,838 $3,027,126 $3,935,671 $1,450,007 $3,012,668 $3,913,772 $1,363,645 $2,187,136 $2,601,002 $935,485 $2,159,285 $2,558,521 $872,733 $2,129,238 $2,512,673 $813,217 $2,096,890 $2,463,295 $756,778 $2,062, 129 $2,410,217 $703,266 $1,809,983 $2,011,944 $583,296 $1,767,556 $1,947,096 $538,268 $1,722, 133 $1,877,651 $495,567 $1,674,038 $1,804,111 $455,210 $1,622,913 $1,725,921 $417,016 $8,686,907 $8,686,907 $2,109,276 NPV $7,785,843.30 Present Value (No Taxes) (Hong Kong) ($3,900,000) ($3,577,982) ($26,748,008) $4,516,924 $4,277,742 $4,049,533 $3,378,855 $2,826,004 $2,629,554 $2,484,455 $2,346,398 $2,214,863 $1,942,112 $1,797,357 $1,691,489 $1,590,708 $1,494,782 $938,715 $872,555 $809,749 $750,139 $693,573 $547,095 $500,316 $455,914 $413,945 $374,206 $1,883,453 $1,727,938.56 AutoSave On 159 Case Study Analysis_Rev.D - Compatibility Mode-Saving.. Search (Alt+Q) Mathew Sadott MS File Home Insert Draw Page Layout Formulas Data Review View Help PDF Suite 2020 Comments Share Split MD View Side by Side Delaut Formula Bar 2 Rulor HH CELI A Hide H Koop Now E Options Gridlines Normal Page Break Page Custom Preview layout layout Viens Headings Zoom 100% Zoom to Selection New Window Arrange Freeze All Panas I Synchronous Scrolling Switch Roset Window Position Windows Macas Unhida Winck MEN N 1 11 Stee Net Moncash Not Working Capital Duvilla , 4401 : She View Vkukbook Vieas Show Zoom R11 VOX P11/([{1+$D$5)/($D$3+1))^B12) B F H PES . 1 M 30-WARIO: 25 YEARS OF USE PURCHASE PRICE QURRENT PURCHASE PRICE PAYABLE 2300 1000 EXECTED RATE OF RFLATO "" NEXT YEARS TURCHASE ACETAPA 2013 10 TAXHALL 36 DISCOUNT RATE NWNIVESIMENI INNE WORKING CAPITAL Sun 30 9003 ESTIMATED SCRAP VALUE 55.CCO 003 GE OF HORSABE OF OPERATIO 661 Lxpected Capital Daily Age of Ship Calendar Year YA Daily Hire in Operating Revenues Opiling Year Expandinis Depreciado Farming B " 8 Ilmy Taxes Care Net Income TAMA Cuel Rule . 3 2003 (53.995.2003 THI 1 2001 $39330 1 22 12 3 23.900 TY 54.900 51.149.900 151.460.035) 51.291.211) is 13 SP 2 4 2004 34.BU TUJ 52.02.09 23.200 357 54,150 ST 211,400 151,53430 $1.291,2171 5 549834 12 3 5 2005 2: 400 357 $4326 82,561,199 $723230 15157) 138 $1291 2171 2 54 412 447 $ SH 1571 15 11/14 52 868 001 51406951999, $ 312017111 16 SA 53113 / 2007 52 18h 5300.0001 17.23 T4.579 J! 151, 07.93) $1.21,217 52.110 21 501.52.122.004 5 2009 1461 353 34,BET $6.73.153 151.775 313 53,043 263 031142 51.578 121 10 81,251,2171 7 28 1752 353 35.361 1716 A 21 15173561 93 043161 $11512171 $0.1273157808 19 $ 21 1 33 1 55.214 9:11,23 15101 S2111 $ 11 SIWICE 20 2011 151.993.111 13.152 353 35474 55.335 476 51,251,2171 7 10 202 5350,000 53.3T141 15.083.0251.574, 147 17428 35355,602 2,464 56 52.384 81,361,2171 22 152 073 035) 11 52,712 832 12.57 1949431 51,763,341 $5,131 $ 11.938 1939 19 112 12181157 $1,1612171 23 12 2014 17.131 ! 13.10 15 $17.SI 152 2733 91 221.219 12 51.11.2011 52.012.199 20 205 15.036 349 55404 SIZ 56.234.54 152.307.93 51.351,2171 2. 14 28 48 1.5612171 2014 32.000 19,243 51,5ET.295 349 15909.544 55 560 56 355 307 152.4310 SET E904 82,574 583 51.573 473 15 7/1993, 151028 128MB 14 159 31.4117111 $1.189411 15413 16 SI 203 2.3214952204 9211.200 152 S1411211 51.140 GA 17 15789 235 28 209 15,104 34957,482 55.271.256 152.734 553 ST2431 18 81-441,2171 200) 51,096 527 15383434 15.278 349 350 3533272 S72 ST2012 15283151 $1.41 2171 51 246 871 1586435 30 191 201 5680465 19,44 119 118 11415 159 11 31411 111 58411 500 37 20 2022 50 53.0.6001 14.504 349 51.42T 144.246 153 DTGOJE 1.451,217 21 2023 SOTT 029 1520.9301 5375,053 HS 12 53.764 $5.172.227 153, 199040 51451,2171 20M 55 2.970 14,958 319 15179.510 $9,115 5333431 9:40 $6212 557 15.3.07081 $14612171 20 5444335 15156 511 598882: 2009 15.11 145 24 51212,134 191211111 S1411111 Seard 3361 15131 2023 15.341 149 SM $9.99 55.254,909 153,691 411 51451,211 56,719,582 5294 JE 2027 15100031 $19.3: 13.448 349 $ 0.253 $4693,352 153 42 424 81.21.21 58402391 Tria 15340 2331 TH Vale 1.11.12 3 110,000 815,4501 515912 SIE SIE! SIC.CO 817,385 $17511 4 .4 189 HBPB - E En & #| 5.291.217 51 291.217 $ 231 211 $ 211,211 51 751.211 $1351.217 $1251217 S 11.21 51351.219 $1351.217 S18121 5361211 51351.217 21 $ 351217 $1641212 51241.21 5+241.217 $1441217 $441,711 5461.212 $1461.217 $1461217 $211211 31461.21 $1291217 819, cei 519,5721 SLIME 520) 821,306 52298 15322 1523.30 824,0T) 524793 Cash flow (Tue) Cushllow Taxual Present Value THER) inw York Hong Kong inw York (53.930,000 53.92.CO (53.930,000 (53.930,000 539 C00 $3932,200 15.03 155.000 SBS 54.120.936 55.000 5.91.140 54.136,905 55,577,000 53,634,00 $414330 S56775 3456 157 SHIDAH $9,972 21 $7. 51.6.500 54.446,165 52.525.000 53,311,549 52.256,63 $3,311 $13761621 $2 227 228 S. $414 52,134 DA 53.36.362 54.369,364 51.356,309 53,104,506 54,354 477 $1,752,66) $1,35627 $, $1.03 51.30 uri 51,814 51.610.03 53.2273 53.95 ET 51.456.COT 53212 663 53,313 772 $1,353,645 $2.13/12 $2401 BRD son 52.10.2016 52.506.12 52,129,239 52.512,673 5613 27 $2,3560 52.46325 5756 773 $7,019 12 32.1101/ S 1221 51.909.00 52.211. 500295 $1,267,666 51,341,096 5538 253 $1.29 183 $1,877661 3456 587 $1.5L $1,10411 $1,622,912 51.726.12 54170's 53,556 SOT 53,556 307 $3,606 DOT AN PIH VINO TEHO INTER Hong Kong (53.930,000 $3,577582 1598.744,00 54.516. 54.277,742 54,319,523 31.1 52.126.00 52,529,554 $24344 32.100 52.214,00 51,342, 112 $1,75757 51.5 IN $1.550.700 $1494782 XL 215 172.500 5903.749 $75) 139 9, 5847.256 5503,216 $ 55,911 $213.30 50206 53,556 BOT 326.2001 827,9 1825,00) 51,16 17 LII 42 13 42 45 46 an 49 50 he 12 53 52 56 57 Exhibit 1 Exhibit 3 Exhibit 4 Exhibits 25 Years of Use Ready Accessibility: Unavailable HE + 0x 12:22 PM 1/25/2022 Age Event Calendar Capital of Ship Year Year Expenditures 1 2 3 4 5 6 7 8 9 10 11 12 13 14 15 16 17 18 19 20 21 22 23 24 25 0 0 1 2 3 3 4 5 5 6 7 8 9 10 11 12 13 14 15 16 17 18 19 20 21 22 23 24 25 26 27 2000 -$ -$3,900,000 2001 $3,900,000 2002 $31,200,000 2003 2004 2005 2006 2007 -$300,000 2008 2009 2010 2011 2012 -S350,000 2013 2014 2015 2016 2017 $750,000 2018 2019 2020 2021 2022 -S850,000 2023 2024 2025 2026 2027 $6,719.582 Expected Operatin Daily Net Noncash Change in Depreciation Earnings Operating Daily Hire Present 8 Net Present 8 Net Before of Operating Revenues Items Cash Flow Cash Flow Tax (35%) Costs Value Value Rate Day Cost Total ) Income (Depreciation Working Taxes (EBT) (Tax) (No Tax) Addback) Capital (Tax) (No Tax) -$3,900,000 $3,900,000 $3,900,000 $3,900,000 -$3,900,000 $3,900,000 $3,577,982 -$3,577,982 -$500,000 - $31.700,000-$31,700,000 -$26.681,256 -$26,681,256 $20,000 357 $4,000 $7,140,000 $1,460,000 $1,291,217 $4,388,783 $1,536,074 $2,852,709 $1,291,217 $15,000 $4,128,926 $5,665,000 $3,188,288 $4,374.419 $20,200 357 $4,160 $7,211,400 $1,518,400 $1,291,217 $4,401,783 $1,540,624 $2,861,159 S1,291,217 -S15,450 $4,136,926 $5,677,550 $2,930,703 $4,022,120 $20,400 357 $4,326 $7,282,800 $1,579,136 -$1,291,217 $4,412,447 $1,544,357 $2,868,091 $1,291,217 -S15,914 $4,143,394 $5,687,751 $2,692,922 $3,696,648 $18,714 357 $4,499 $6,680,898 $1,642,301 $1,291,217 $3,747,380 $1,311,583 $2,435,797 $1,291,217 -S16,391 $3,710,623 $5,022,206 $2.212,523 $2.994,577 $17.283 357 $4,679 $6,170,031 -S1,707,993 $1,351,217 $3,110,821 -S1,088,787 $2,022,034 $1,351,217 -S16,883 $3,056,368 $4,145,155 $1,671,938 $2,267,542 $ $ $17,481 353 $4,867 $6,170,793 -S1,776,313 -$1,351,217 $3,043,263 -$1,065,142 $1,978,121 S1,351,217 -$17,389 $3,311,949 $4,377,091 $1,662,155 $2,196,714 $17.682 353 $5,061 $6,241,746 $1,847,366 $1,351,217 $3,043,164 $1,065,107 $1,978,056 $1,351,217 -$17,911 $3,311,362 $4,376,469 $1,524,643 $2.015.048 $17.886 353 $5,264 $6,313,758 $1,921,260 $1,351,217 $3,041,281 $1,064,448 $1,976,833 $1,351,217 -S18,448 $3,309,601 $4,374,049 $1,398,011 $1,847,646 $18,092 353 $5,474 $6,386,476 -$1,998,111 $1,351,217 $3,037,148 $1,063,002 $1,974,147 $1,351,217 -$19,002 $3,306,362 $4,369,364 $1,281,324 $1,693,272 $17,428 353 $5,693 $6,152,084 $2,078,035 -$1,361,217 $2,712,832 -$949,491 $1,763,341 $1,361,217 $19,572 $2,754,986 $3,704,477 $979,493 $1,317,070 $17,628 349 $5,921 $6,152,172 $2,161,157 $1,361,217 $2,629,799 -$920,430 $1,709,369 $1,361,217 -$20,159 $3,050 427 $3.970,857 $994,984 $1,295,209 $ $17,831 349 $6,158 $6,223,019 $2,247,603 $1,361,217 $2,614,199 -$914,970 $1,699,230 S1,361,217 -$20,764 $3,039,683 $3,954,653 $909,614 $1,183,416 $18,036 349 $6,404 $6,294,564 -$2,337,507 $1,361,217 $2,595,840 -$908,544 $1,687,296 S1,361,217 -$21,386 $3,027,126 $3,935,671 $831,061 $1,080,491 $18,243 349 $6,660 $6,366,807 $2,431,007 $1,361,217 $2,574,583 -$901,104 $1,673,479 S1,361,217 S22,028 $3,012,668 $3,913,772 $758.800 $985,761 $14,762 349 $6,927 $5,151,938 $2,528,248 $1,441,217 $1,182,474 -S413,866 S768,608 $1,441,217 -$22,689 $1,437,136 $1,437,136 $1,851,002 $332,084 $427,717 $14.932 349 $7,204 $5,211,268 S2,629,378 $1,441,217 $1,140,674 $399,236 $741,438 $1,441,217 -$23,370 $2,159,285 $2,558,521 $457,755 $542,390 $15,104 349 $7,492 $5,271,296 $2,734,553 $1,441,217 $1,095,527 $ -$383,434 $712,092 $1,441,217 $24,071 $2,129,238 $2,512,673 $414,115 $488,689 $15,278 349 $7,792 $5,332,022 $2,843,935 $1,441,217 $1,046,871 - -$366,405 S680,466 $1,441.217 -$24,793 $2,096,890 $2,463,295 $374.150 $439,528 $15.454 349 $8,103 $5,393.446 -S2,957,692 $1,441,217 S994,537 -$348,088 S646,449 $1,441,217 -$25,536 $2,062,129 $2,410,217 $337567 $394,548 $14,654 349 $8,427 $5,114,246 -$3,076,000 $1,461,217 $577,029 -S201.960 $375,069 $1,461,217 -$26,303 $959,983 $1,161,944 $144.172 $174,503 $14,823 349 $8,764 $5,173,227 -$3,199,040 $1,461,217 $512,970 -$179,540 $333,431 S1,461,217 -$27,092 $1,767,556 $1,947,096 $243,536 $268.274 $14.993 349 $9,115 $5,232,557 $3,327,001 -$1,461,217 $444,339 -$155,519 $288,820 $1,461,217 -$27,904 $1,722,133 $1,877,651 $217,686 $237,344 $15,166 349 $9,480 $5,292,934 $3,460,081 $1,461,217 S371,636 -$130,073 S241,568 $1,461,217 S28,742 $1,674,038 $1,804,111 $194.135 $209,219 $15,341 349 $9,859 $5,354,009 $3,598,485 $1,461,217 S294,308 -$103,008 $191,300 $1,461,217 -$29,604 $1,622,913 $1,725,921 $172.666 $183,625 $13,448 349 $10,253 $4,693,352 $3,742,424 $1,291,217 $340,289 $340,289 $1,291,217 $1,016,397 $8,686,907 $8,686,907 $847910 $847910 NPV $7,387,003 $1,024,441 Cash Flow (Taxes) Cash Flow (No Taxes) Present Value (Taxes) (New York (Hong Kong) (New York) ($3,900,000) ($3,900,000) ($3,900,000) ($3,900,000) ($3,900,000) ($3,577,982) ($31,700,000) ($31,700,000) ($26,748,008) $4, 128,926 $5,665,000 $3,901,646 $4, 136,926 $5,677,550 $3,694,020 $4,143,394 $5,687,751 $3,496,137 $3,710,623 $5,022,206 $2,958,624 $3,356,368 $4,445,155 $2,528,850 $3,311,949 $4,377,091 $2,358,023 $3,311,362 $4,376,469 $2,227,829 $3,309,601 $4,374,049 $2,104,076 $3,306,362 $4,369,364 $1,986,309 $3,104,986 $4,054,477 $1,762,653 $3,050,427 $3,970,857 $1,636,359 $3,039,683 $3,954,653 $1,540,838 $3,027,126 $3,935,671 $1,450,007 $3,012,668 $3,913,772 $1,363,645 $2,187,136 $2,601,002 $935,485 $2,159,285 $2,558,521 $872,733 $2,129,238 $2,512,673 $813,217 $2,096,890 $2,463,295 $756,778 $2,062, 129 $2,410,217 $703,266 $1,809,983 $2,011,944 $583,296 $1,767,556 $1,947,096 $538,268 $1,722, 133 $1,877,651 $495,567 $1,674,038 $1,804,111 $455,210 $1,622,913 $1,725,921 $417,016 $8,686,907 $8,686,907 $2,109,276 NPV $7,785,843.30 Present Value (No Taxes) (Hong Kong) ($3,900,000) ($3,577,982) ($26,748,008) $4,516,924 $4,277,742 $4,049,533 $3,378,855 $2,826,004 $2,629,554 $2,484,455 $2,346,398 $2,214,863 $1,942,112 $1,797,357 $1,691,489 $1,590,708 $1,494,782 $938,715 $872,555 $809,749 $750,139 $693,573 $547,095 $500,316 $455,914 $413,945 $374,206 $1,883,453 $1,727,938.56 AutoSave On 159 Case Study Analysis_Rev.D - Compatibility Mode-Saving.. Search (Alt+Q) Mathew Sadott MS File Home Insert Draw Page Layout Formulas Data Review View Help PDF Suite 2020 Comments Share Split MD View Side by Side Delaut Formula Bar 2 Rulor HH CELI A Hide H Koop Now E Options Gridlines Normal Page Break Page Custom Preview layout layout Viens Headings Zoom 100% Zoom to Selection New Window Arrange Freeze All Panas I Synchronous Scrolling Switch Roset Window Position Windows Macas Unhida Winck MEN N 1 11 Stee Net Moncash Not Working Capital Duvilla , 4401 : She View Vkukbook Vieas Show Zoom R11 VOX P11/([{1+$D$5)/($D$3+1))^B12) B F H PES . 1 M 30-WARIO: 25 YEARS OF USE PURCHASE PRICE QURRENT PURCHASE PRICE PAYABLE 2300 1000 EXECTED RATE OF RFLATO "" NEXT YEARS TURCHASE ACETAPA 2013 10 TAXHALL 36 DISCOUNT RATE NWNIVESIMENI INNE WORKING CAPITAL Sun 30 9003 ESTIMATED SCRAP VALUE 55.CCO 003 GE OF HORSABE OF OPERATIO 661 Lxpected Capital Daily Age of Ship Calendar Year YA Daily Hire in Operating Revenues Opiling Year Expandinis Depreciado Farming B " 8 Ilmy Taxes Care Net Income TAMA Cuel Rule . 3 2003 (53.995.2003 THI 1 2001 $39330 1 22 12 3 23.900 TY 54.900 51.149.900 151.460.035) 51.291.211) is 13 SP 2 4 2004 34.BU TUJ 52.02.09 23.200 357 54,150 ST 211,400 151,53430 $1.291,2171 5 549834 12 3 5 2005 2: 400 357 $4326 82,561,199 $723230 15157) 138 $1291 2171 2 54 412 447 $ SH 1571 15 11/14 52 868 001 51406951999, $ 312017111 16 SA 53113 / 2007 52 18h 5300.0001 17.23 T4.579 J! 151, 07.93) $1.21,217 52.110 21 501.52.122.004 5 2009 1461 353 34,BET $6.73.153 151.775 313 53,043 263 031142 51.578 121 10 81,251,2171 7 28 1752 353 35.361 1716 A 21 15173561 93 043161 $11512171 $0.1273157808 19 $ 21 1 33 1 55.214 9:11,23 15101 S2111 $ 11 SIWICE 20 2011 151.993.111 13.152 353 35474 55.335 476 51,251,2171 7 10 202 5350,000 53.3T141 15.083.0251.574, 147 17428 35355,602 2,464 56 52.384 81,361,2171 22 152 073 035) 11 52,712 832 12.57 1949431 51,763,341 $5,131 $ 11.938 1939 19 112 12181157 $1,1612171 23 12 2014 17.131 ! 13.10 15 $17.SI 152 2733 91 221.219 12 51.11.2011 52.012.199 20 205 15.036 349 55404 SIZ 56.234.54 152.307.93 51.351,2171 2. 14 28 48 1.5612171 2014 32.000 19,243 51,5ET.295 349 15909.544 55 560 56 355 307 152.4310 SET E904 82,574 583 51.573 473 15 7/1993, 151028 128MB 14 159 31.4117111 $1.189411 15413 16 SI 203 2.3214952204 9211.200 152 S1411211 51.140 GA 17 15789 235 28 209 15,104 34957,482 55.271.256 152.734 553 ST2431 18 81-441,2171 200) 51,096 527 15383434 15.278 349 350 3533272 S72 ST2012 15283151 $1.41 2171 51 246 871 1586435 30 191 201 5680465 19,44 119 118 11415 159 11 31411 111 58411 500 37 20 2022 50 53.0.6001 14.504 349 51.42T 144.246 153 DTGOJE 1.451,217 21 2023 SOTT 029 1520.9301 5375,053 HS 12 53.764 $5.172.227 153, 199040 51451,2171 20M 55 2.970 14,958 319 15179.510 $9,115 5333431 9:40 $6212 557 15.3.07081 $14612171 20 5444335 15156 511 598882: 2009 15.11 145 24 51212,134 191211111 S1411111 Seard 3361 15131 2023 15.341 149 SM $9.99 55.254,909 153,691 411 51451,211 56,719,582 5294 JE 2027 15100031 $19.3: 13.448 349 $ 0.253 $4693,352 153 42 424 81.21.21 58402391 Tria 15340 2331 TH Vale 1.11.12 3 110,000 815,4501 515912 SIE SIE! SIC.CO 817,385 $17511 4 .4 189 HBPB - E En & #| 5.291.217 51 291.217 $ 231 211 $ 211,211 51 751.211 $1351.217 $1251217 S 11.21 51351.219 $1351.217 S18121 5361211 51351.217 21 $ 351217 $1641212 51241.21 5+241.217 $1441217 $441,711 5461.212 $1461.217 $1461217 $211211 31461.21 $1291217 819, cei 519,5721 SLIME 520) 821,306 52298 15322 1523.30 824,0T) 524793 Cash flow (Tue) Cushllow Taxual Present Value THER) inw York Hong Kong inw York (53.930,000 53.92.CO (53.930,000 (53.930,000 539 C00 $3932,200 15.03 155.000 SBS 54.120.936 55.000 5.91.140 54.136,905 55,577,000 53,634,00 $414330 S56775 3456 157 SHIDAH $9,972 21 $7. 51.6.500 54.446,165 52.525.000 53,311,549 52.256,63 $3,311 $13761621 $2 227 228 S. $414 52,134 DA 53.36.362 54.369,364 51.356,309 53,104,506 54,354 477 $1,752,66) $1,35627 $, $1.03 51.30 uri 51,814 51.610.03 53.2273 53.95 ET 51.456.COT 53212 663 53,313 772 $1,353,645 $2.13/12 $2401 BRD son 52.10.2016 52.506.12 52,129,239 52.512,673 5613 27 $2,3560 52.46325 5756 773 $7,019 12 32.1101/ S 1221 51.909.00 52.211. 500295 $1,267,666 51,341,096 5538 253 $1.29 183 $1,877661 3456 587 $1.5L $1,10411 $1,622,912 51.726.12 54170's 53,556 SOT 53,556 307 $3,606 DOT AN PIH VINO TEHO INTER Hong Kong (53.930,000 $3,577582 1598.744,00 54.516. 54.277,742 54,319,523 31.1 52.126.00 52,529,554 $24344 32.100 52.214,00 51,342, 112 $1,75757 51.5 IN $1.550.700 $1494782 XL 215 172.500 5903.749 $75) 139 9, 5847.256 5503,216 $ 55,911 $213.30 50206 53,556 BOT 326.2001 827,9 1825,00) 51,16 17 LII 42 13 42 45 46 an 49 50 he 12 53 52 56 57 Exhibit 1 Exhibit 3 Exhibit 4 Exhibits 25 Years of Use Ready Accessibility: Unavailable HE + 0x 12:22 PM 1/25/2022
Step by Step Solution
There are 3 Steps involved in it

Get step-by-step solutions from verified subject matter experts