

Question: please help Find the indicated z score. The graph depicts the standard normal distribution of bone density scores with mean 0 and standard deviation 1.
please help
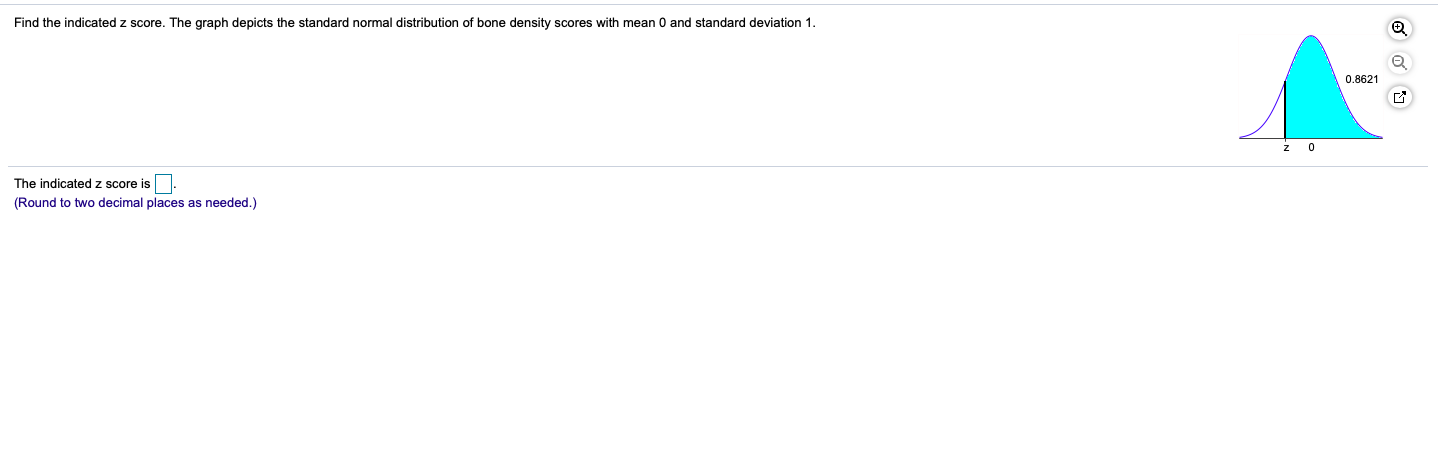
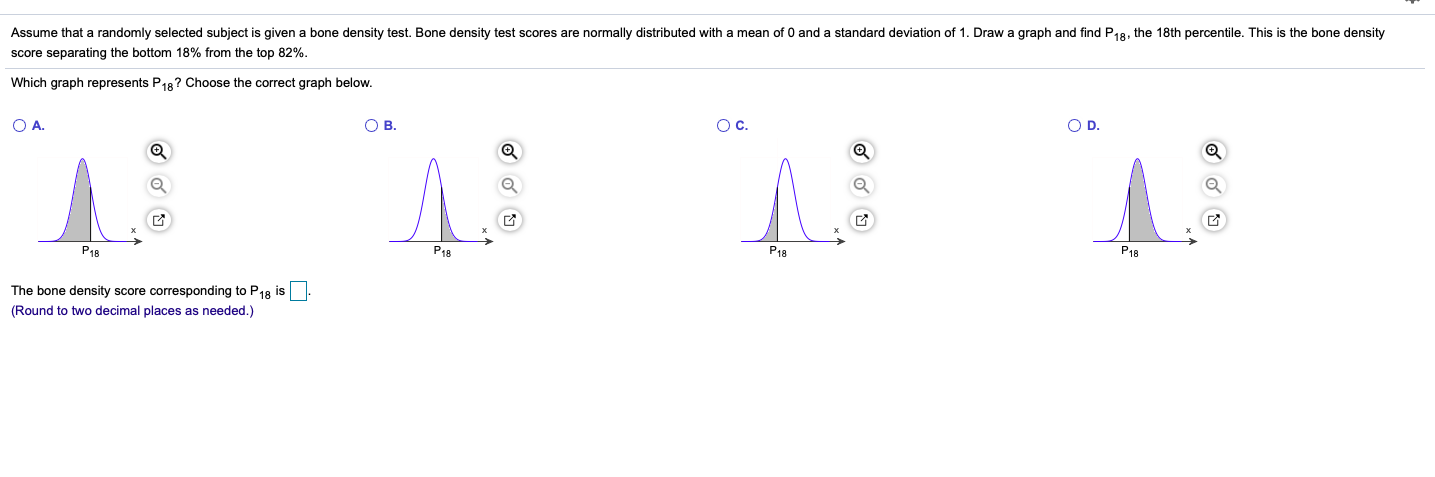
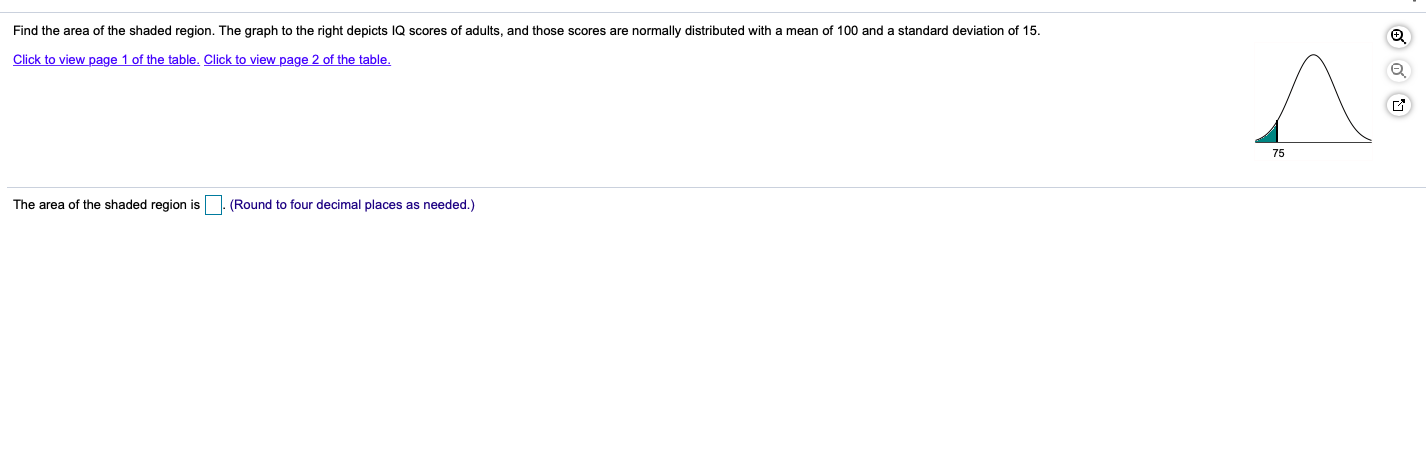
Find the indicated z score. The graph depicts the standard normal distribution of bone density scores with mean 0 and standard deviation 1. 0.8621 Z The indicated z score is. (Round to two decimal places as needed.)Assume that a randomly selected subject is given a bone density test. Bone density test scores are normally distributed with a mean of 0 and a standard deviation of 1. Draw a graph and find P,, the 18th percentile. This is the bone density score separating the bottom 18% from the top 82%. Which graph represents P18? Choose the correct graph below. O A. OB. O C. OD. P18 P18 P18 P18 The bone density score corresponding to P 18 is]. (Round to two decimal places as needed.)Find the area of the shaded region. The graph to the right depicts IQ scores of adults, and those scores are normally distributed with a mean of 100 and a standard deviation of 15. Click to view page 1 of the table. Click to view page 2 of the table. 75 The area of the shaded region is . (Round to four decimal places as needed.)Assume that an adult female is randomly selected. Suppose females have pulse rates that are normally distributed with a mean of 76.0 beats per minute and a standard deviation of 11.5 beats per minute. Find Pes, which is the pulse rate separating the bottom 95% from the top 5%. (Hint: Draw a graph.) P9s = (Round to one decimal place as needed.)
Step by Step Solution
There are 3 Steps involved in it

Get step-by-step solutions from verified subject matter experts