

Question: Please help find the range on the sample data with Years, hurricanes, years ^2, hurricanes ^2 the standard deviation with Years, hurricanes, years ^2, hurricanes
Please help find the range on the sample data with Years, hurricanes, years ^2, hurricanes ^2
the standard deviation with Years, hurricanes, years ^2, hurricanes ^2
the variance of sample data with Years, hurricanes, years ^2, hurricanes ^2
and the important feature of the data is not revealed. Thanks will thumbs up if answered soon.
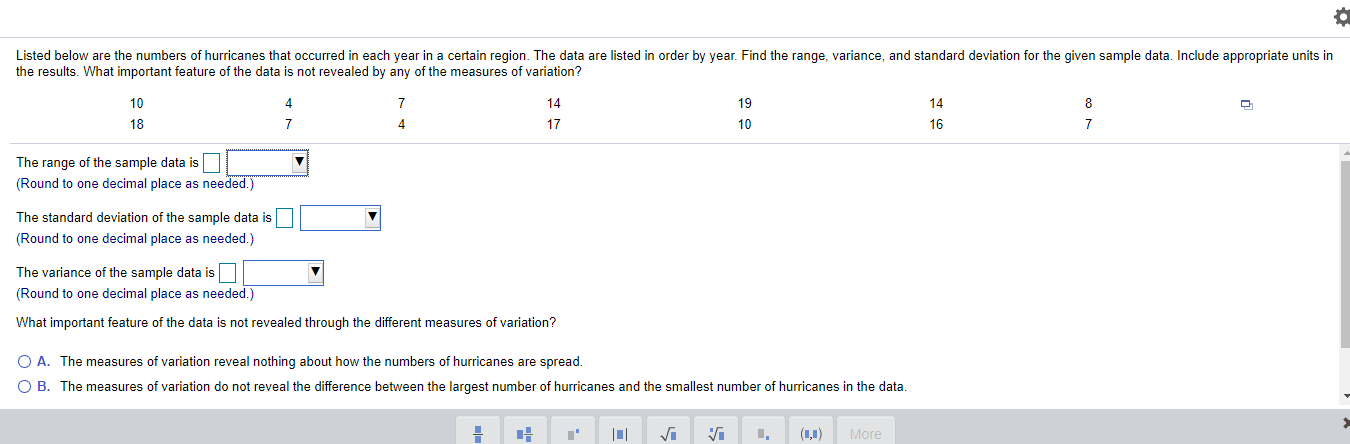
Listed below are the numbers of hurricanes that occurred in each year in a certain region. The data are listed in order by year. Find the range, variance, and standard deviation for the given sample data. Include appropriate units in the results. What important feature of the data is not revealed by any of the measures of variation? 10 14 19 14 18 17 10 16 The range of the sample data is (Round to one decimal place as needed.) The standard deviation of the sample data is (Round to one decimal place as needed.) The variance of the sample data is (Round to one decimal place as needed.) What important feature of the data is not revealed through the different measures of variation? O A. The measures of variation reveal nothing about how the numbers of hurricanes are spread. O B. The measures of variation do not reveal the difference between the largest number of hurricanes and the smallest number of hurricanes in the data. More
Step by Step Solution
There are 3 Steps involved in it

Get step-by-step solutions from verified subject matter experts