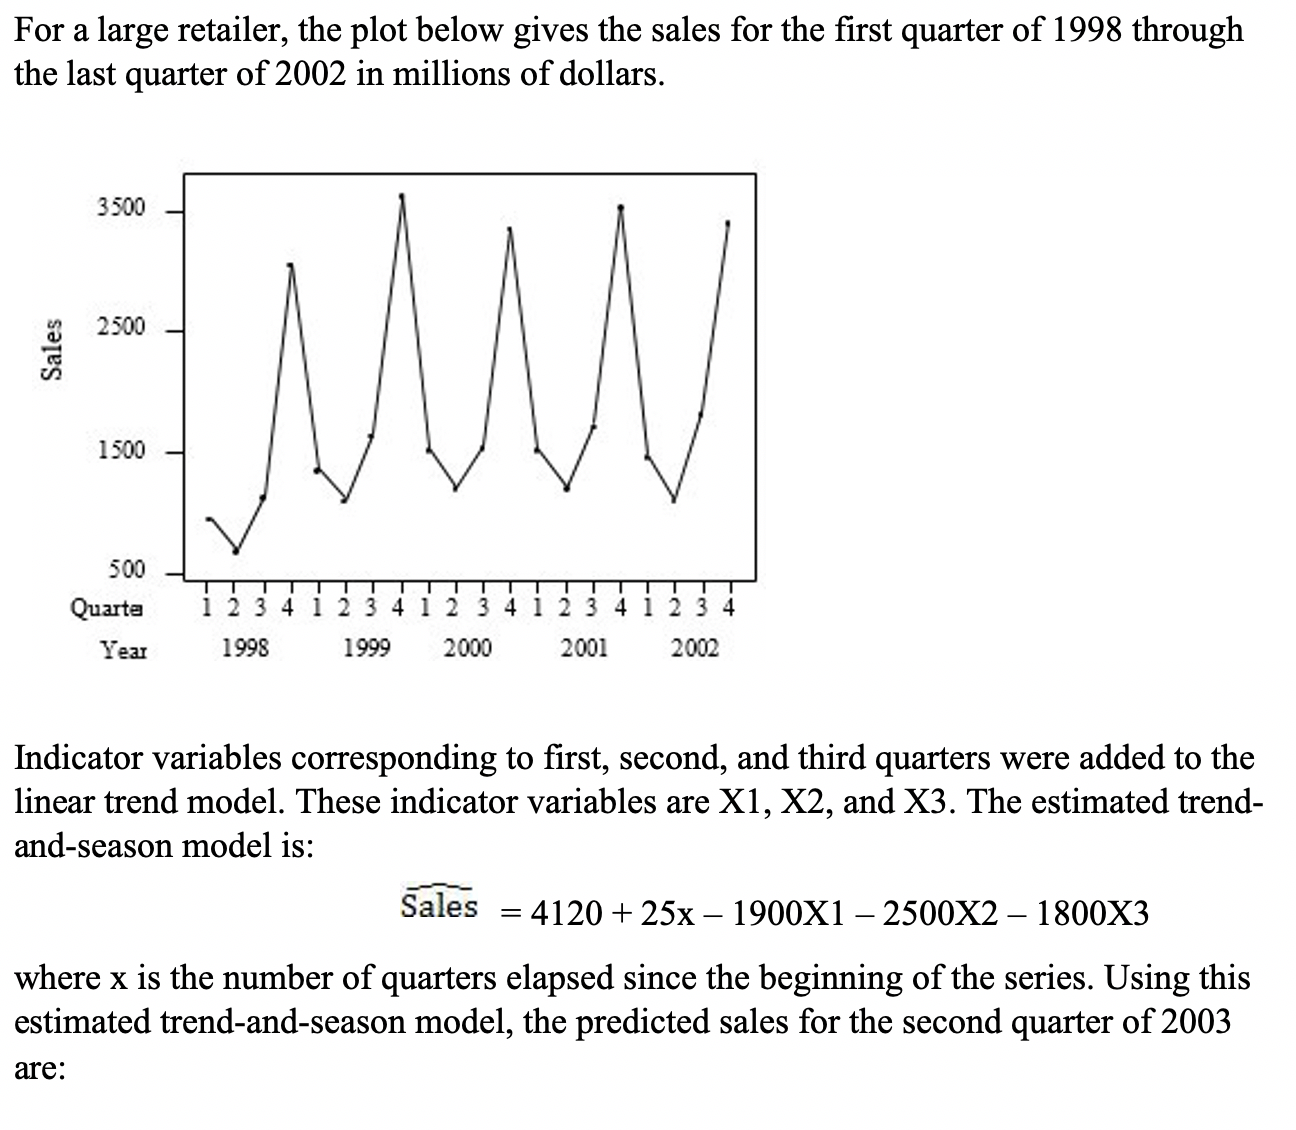
Question: please help For a large retailer, the plot below gives the sales for the rst quarter of 1998 through the last quarter of 2002 in

please help

please help For a large retailer, the plot below
For a large retailer, the plot below gives the sales for the rst quarter of 1998 through the last quarter of 2002 in millions of dollars. 3500 2500 Sales 1500 500 Quads 12341234123412341234 Yea: 1998 1999 2000 2001 2002 Indicator variables corresponding to rst, second, and third quarters were added to the linear trend model. These indicator variables are X1, X2, and X3. The estimated trend and-season model is: Sales = 4120 + 25x 1900X1 2500X2 1800X3 where x is the number of quarters elapsed since the beginning of the series. Using this estimated trend-andseason model, the predicted sales for the second quarter of 2003 are

Step by Step Solution

There are 3 Steps involved in it

1 Expert Approved Answer
Step: 1 Unlock blur-text-image
Question Has Been Solved by an Expert!

Get step-by-step solutions from verified subject matter experts

Step: 2 Unlock
Step: 3 Unlock

Students Have Also Explored These Related Finance Questions!