

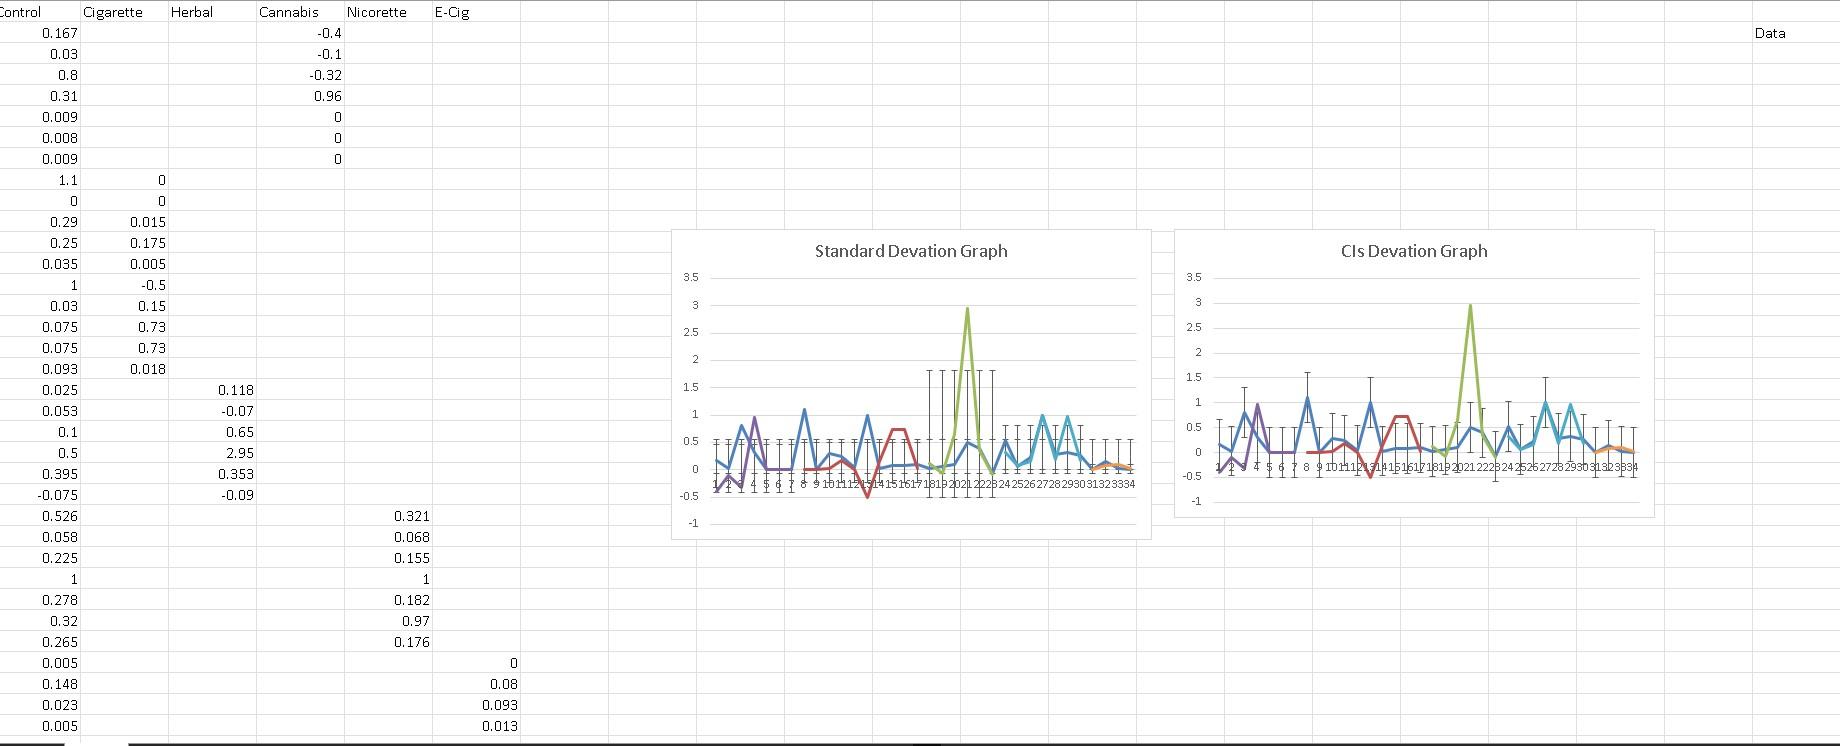
Question: Please help Herbal Nicorette E-Cig Control Cigarette 0.167 0.03 Data Cannabis -0.4 -0.1 -0.32 0.96 0.8 0.31 0.009 0.008 0.009 0 0 1.1 0 Standard
 Please help
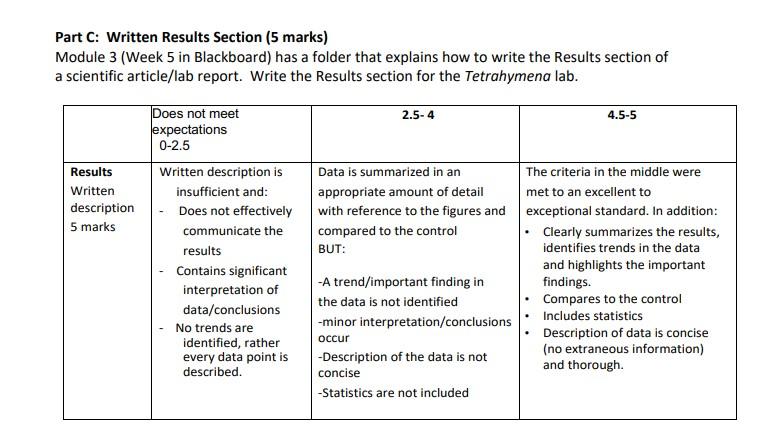
Herbal Nicorette E-Cig Control Cigarette 0.167 0.03 Data Cannabis -0.4 -0.1 -0.32 0.96 0.8 0.31 0.009 0.008 0.009 0 0 1.1 0 Standard Devation Graph Cls Devation Graph 0 0 0.015 0.175 0.005 -0.5 0.15 0.73 0.73 0.018 3.5 3.5 3 3 2.5 2.5 2 2 2 2 1.5 0.29 0.25 0.035 1 0.03 0.075 0.075 0.093 0.025 0.053 0.1 0.5 0.395 -0.075 0.526 0.058 0.225 1.5 the time the 1 1 0.118 -0.07 0.65 2.95 0.353 -0.09 0.5 0.5 0 0 $11011111151515151520212223242526272829303135 -0.5 N 5 1 791111213141516171819202122232425262728293031323334 -0.5 -1 0.321 -1 0.068 0.155 1 0.182 0.97 0.176 1 0.278 0.32 0.265 0.005 0.148 0.023 0.005 0 0.08 0.093 0.013 Part C: Written Results Section (5 marks) Module 3 (Week 5 in Blackboard) has a folder that explains how to write the Results section of a scientific article/lab report. Write the Results section for the Tetrahymena lab. 2.5-4 4.5-5 Results Written description 5 marks Does not meet expectations 0-2.5 Written description is insufficient and Does not effectively communicate the results Contains significant interpretation of data/conclusions No trends are identified, rather every data point is described. Data is summarized in an appropriate amount of detail with reference to the figures and compared to the control BUT: The criteria in the middle were met to an excellent to exceptional standard. In addition: Clearly summarizes the results, identifies trends in the data and highlights the important findings. Compares to the control Includes statistics Description of data is concise (no extraneous information) and thorough. -A trend/important finding in the data is not identified -minor interpretation/conclusions occur -Description of the data is not concise -Statistics are not included Herbal Nicorette E-Cig Control Cigarette 0.167 0.03 Data Cannabis -0.4 -0.1 -0.32 0.96 0.8 0.31 0.009 0.008 0.009 0 0 1.1 0 Standard Devation Graph Cls Devation Graph 0 0 0.015 0.175 0.005 -0.5 0.15 0.73 0.73 0.018 3.5 3.5 3 3 2.5 2.5 2 2 2 2 1.5 0.29 0.25 0.035 1 0.03 0.075 0.075 0.093 0.025 0.053 0.1 0.5 0.395 -0.075 0.526 0.058 0.225 1.5 the time the 1 1 0.118 -0.07 0.65 2.95 0.353 -0.09 0.5 0.5 0 0 $11011111151515151520212223242526272829303135 -0.5 N 5 1 791111213141516171819202122232425262728293031323334 -0.5 -1 0.321 -1 0.068 0.155 1 0.182 0.97 0.176 1 0.278 0.32 0.265 0.005 0.148 0.023 0.005 0 0.08 0.093 0.013 Part C: Written Results Section (5 marks) Module 3 (Week 5 in Blackboard) has a folder that explains how to write the Results section of a scientific article/lab report. Write the Results section for the Tetrahymena lab. 2.5-4 4.5-5 Results Written description 5 marks Does not meet expectations 0-2.5 Written description is insufficient and Does not effectively communicate the results Contains significant interpretation of data/conclusions No trends are identified, rather every data point is described. Data is summarized in an appropriate amount of detail with reference to the figures and compared to the control BUT: The criteria in the middle were met to an excellent to exceptional standard. In addition: Clearly summarizes the results, identifies trends in the data and highlights the important findings. Compares to the control Includes statistics Description of data is concise (no extraneous information) and thorough. -A trend/important finding in the data is not identified -minor interpretation/conclusions occur -Description of the data is not concise -Statistics are not included
Step by Step Solution
There are 3 Steps involved in it

Get step-by-step solutions from verified subject matter experts