

Question: Please help here and please show work I'm asking for a favor. Thank u in advance. 021 Test 1 us? The boxplot shown below results
Please help here and please show work I'm asking for a favor. Thank u in advance.
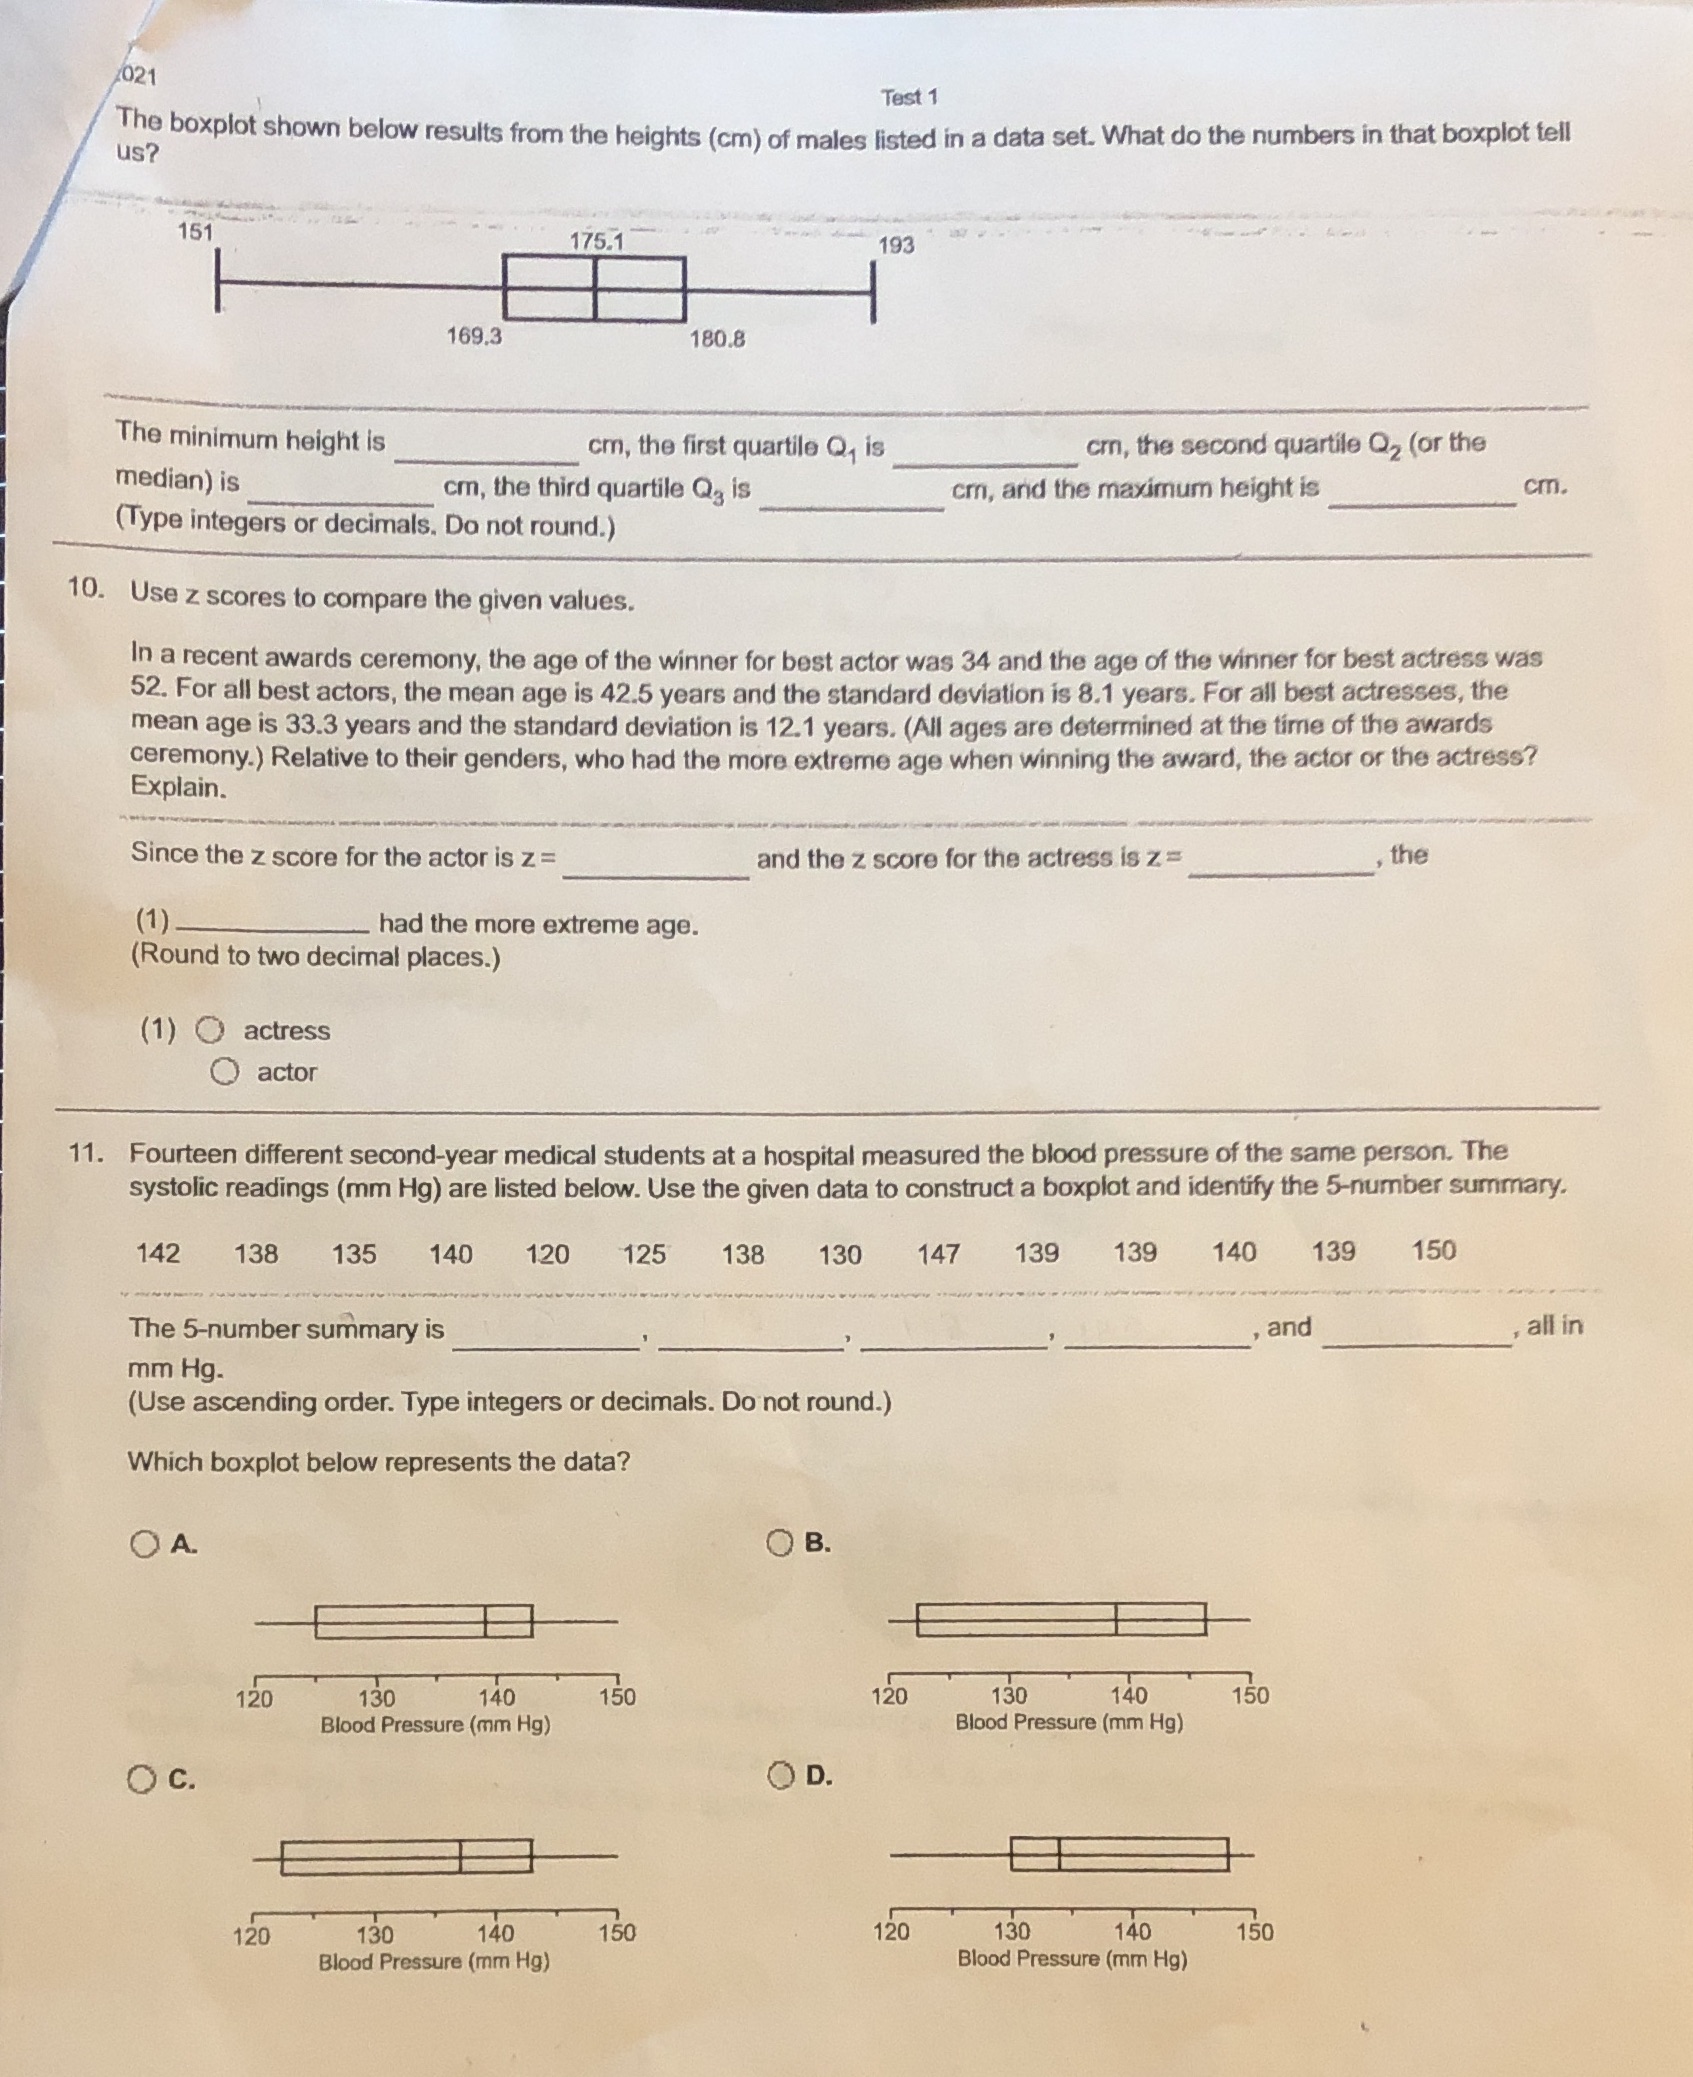
021 Test 1 us? The boxplot shown below results from the heights (cm) of males listed in a data set. What do the numbers in that boxplot tell 151 175.1 193 169.3 180.8 The minimum height is cm, the first quartile Q, is crn, the second quartile Oz (or the median) is cm, the third quartile Q is cm, and the maximum height is cm. (Type integers or decimals. Do not round.) 10. Use z scores to compare the given values. In a recent awards ceremony, the age of the winner for best actor was 34 and the age of the winner for best actress was 52. For all best actors, the mean age is 42.5 years and the standard deviation is 8.1 years. For all best actresses, the mean age is 33.3 years and the standard deviation is 12.1 years. (All ages are determined at the time of the awards ceremony.) Relative to their genders, who had the more extreme age when winning the award, the actor or the actress? Explain. Since the z score for the actor is z = and the z score for the actress is z= the (1) had the more extreme age. Round to two decimal places.) (1) O actress actor 11. Fourteen different second-year medical students at a hospital measured the blood pressure of the same person. The systolic readings (mm Hg) are listed below. Use the given data to construct a boxplot and identify the 5-number summary. 142 138 135 140 120 125 138 130 147 139 139 140 139 150 The 5-number summary is and all in mm Hg. Use ascending order. Type integers or decimals. Do not round.) Which boxplot below represents the data? OA O B 120 130 140 150 20 130 140 150 Blood Pressure (mm Hg) Blood Pressure (mm Hg) O c. O D. 120 130 140 150 120 130 140 150 Blood Pressure (mm Hg) Blood Pressure (mm Hg)
Step by Step Solution
There are 3 Steps involved in it

Get step-by-step solutions from verified subject matter experts