

Question: please help! Here are comparative financial statement data for Waterway Company and Cynthia Company, two competitors. All data are as of December 31, 2022, and
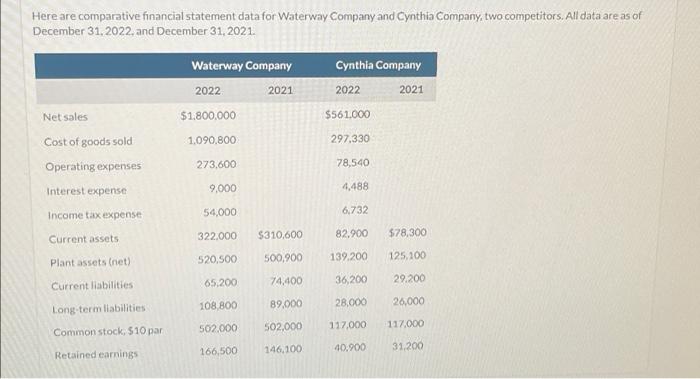

Here are comparative financial statement data for Waterway Company and Cynthia Company, two competitors. All data are as of December 31, 2022, and December 31, 2021. Waterway Company Cynthia Company 2022 2021 2022 2021 Net sales $1,800,000 $561,000 Cost of goods sold 1,090,800 297,330 Operating expenses 273,600 78,540 Interest expense 9,000 4,488 Income tax expense 54,000 6,732 Current assets 322,000 82.900 $78,300 Plant assets (net) 520,500 139,200 125,100 Current liabilities 65,200 36,200 29.200 108,800 28,000 26,000 Long-term liabilities 502,000 Common stock, $10 par 117,000 117,000 40,900 166,500 31,200 Retained earnings $310,600 500,900 74,400 89,000 502,000 146,100 Compute the 2022 return on assets and the return on common stockholders' equity ratios for both companies. (Round answers to 1 decimal place, e.g. 12.1%) Waterway Company Cynthia Company Return on assets Return on common stockholders' equity % 96 % 96
Step by Step Solution
There are 3 Steps involved in it

Get step-by-step solutions from verified subject matter experts