

Question: please help hey there is the question..please help You are required to: Write a report that, calculates, compares and explains the changes in the following


please help
hey there is the question..please help
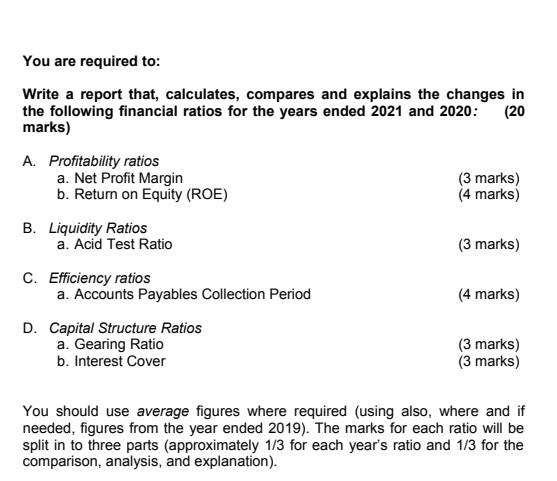
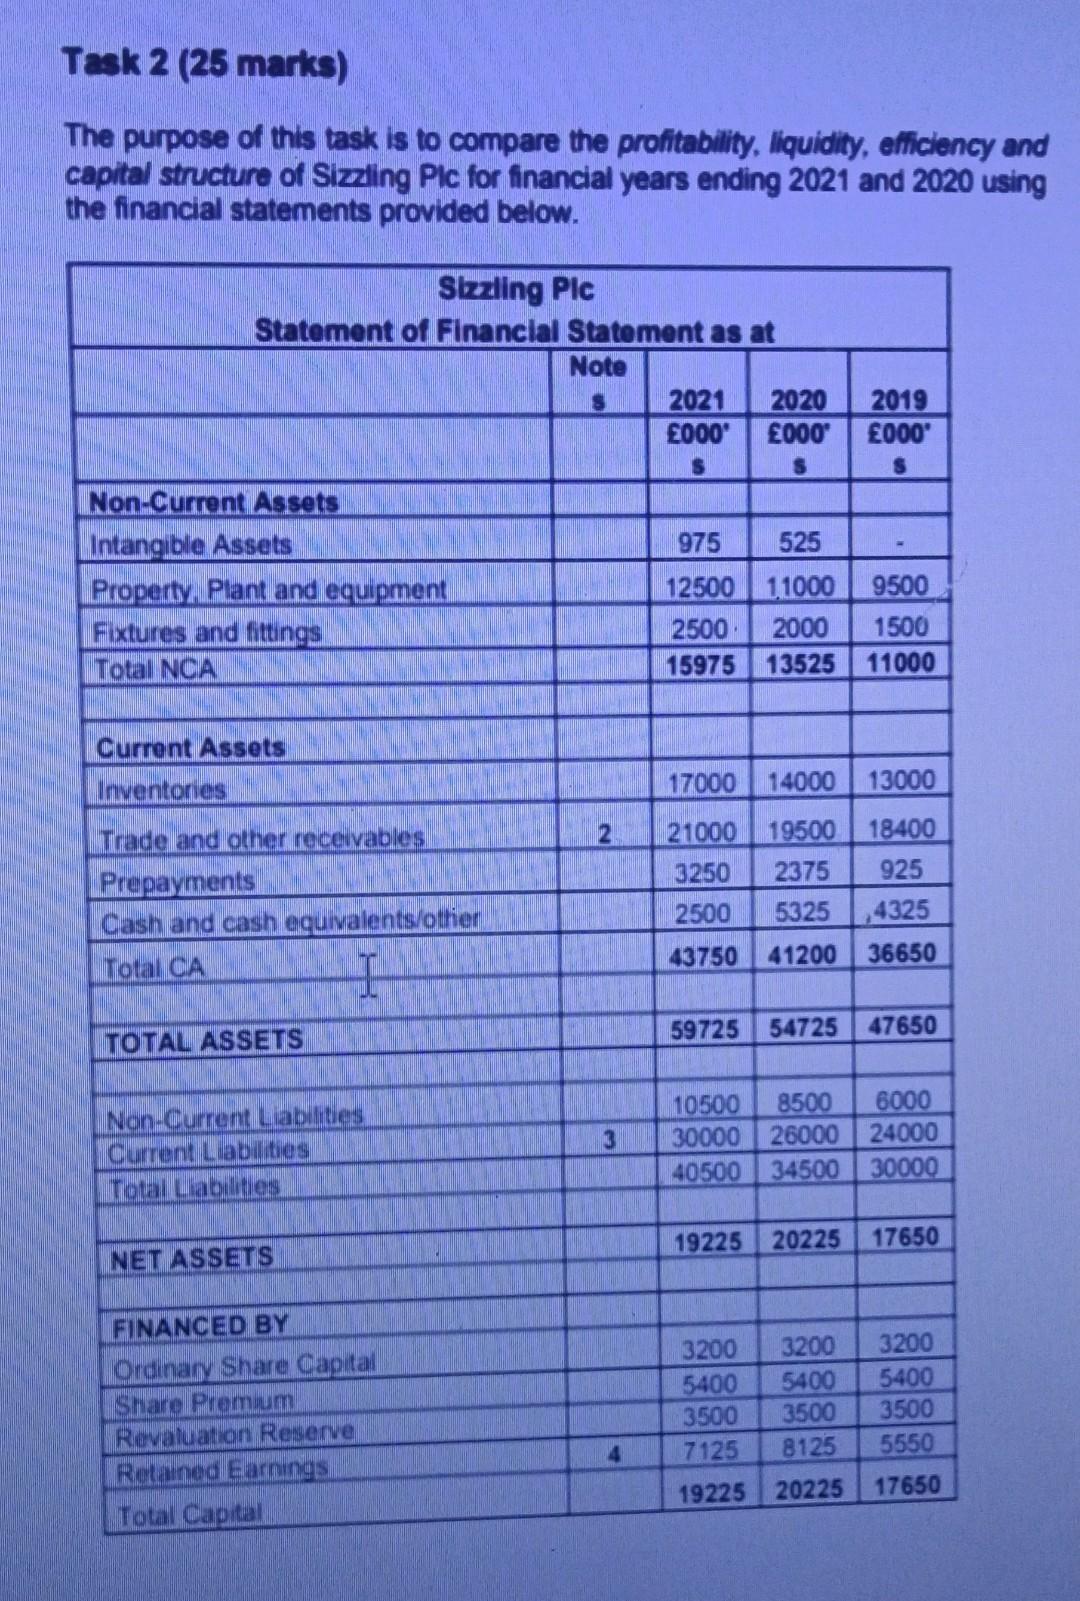
You are required to: Write a report that, calculates, compares and explains the changes in the following financial ratios for the years ended 2021 and 2020: (20 marks) A. Profitability ratios a. Net Profit Margin b. Return on Equity (ROE) (3 marks) (4 marks) B. Liquidity Ratios a. Acid Test Ratio (3 marks) C. Efficiency ratios a. Accounts Payables Collection Period (4 marks) D. Capital Structure Ratios a. Gearing Ratio (3 marks) b. Interest Cover (3 marks) You should use average figures where required (using also, where and if needed, figures from the year ended 2019). The marks for each ratio will be split in to three parts (approximately 1/3 for each year's ratio and 1/3 for the comparison, analysis, and explanation). You are required to: Write a report that, calculates, compares and explains the changes in the following financial ratios for the years ended 2021 and 2020: (20 marks) A. Profitability ratios a. Net Profit Margin b. Return on Equity (ROE) (3 marks) (4 marks) B. Liquidity Ratios a. Acid Test Ratio (3 marks) C. Efficiency ratios a. Accounts Payables Collection Period (4 marks) D. Capital Structure Ratios a. Gearing Ratio (3 marks) b. Interest Cover (3 marks) You should use average figures where required (using also, where and if needed, figures from the year ended 2019). The marks for each ratio will be split in to three parts (approximately 1/3 for each year's ratio and 1/3 for the comparison, analysis, and explanation). You are required to: Write a report that, calculates, compares and explains the changes in the following financial ratios for the years ended 2021 and 2020: (20 marks) A. Profitability ratios a. Net Profit Margin b. Return on Equity (ROE) (3 marks) (4 marks) B. Liquidity Ratios a. Acid Test Ratio (3 marks) C. Efficiency ratios a. Accounts Payables Collection Period (4 marks) D. Capital Structure Ratios a. Gearing Ratio (3 marks) b. Interest Cover (3 marks) You should use average figures where required (using also, where and if needed, figures from the year ended 2019). The marks for each ratio will be split in to three parts (approximately 1/3 for each year's ratio and 1/3 for the comparison, analysis, and explanation). Task 2 (25 marks) The purpose of this task is to compare the profitability, liquidity, efficiency and capital structure of Sizzling Plc for financial years ending 2021 and 2020 using the financial statements provided below. Sizzling Pic Statement of Financial Statement as at Note 2021 2020 2019 000* 000 000 S S S Non-Current Assets Intangible Assets 975 525 Property, Plant and equipment 12500 11000 9500 Fixtures and fittings 2500 2000 1500 Total NCA 15975 13525 11000 Current Assets Inventories 17000 14000 13000 Trade and other receivables 21000 19500 18400 Prepayments 3250 2375 925 Cash and cash equivalents/other 2500 5325 4325 Total CA 43750 41200 36650 I TOTAL ASSETS 59725 54725 47650 Non-Current Liabilities 10500 8500 6000 30000 26000 Current Liabilities 24000 40500 34500 30000 Total Liabilities 19225 20225 17650 NET ASSETS FINANCED BY 3200 3200 3200 Ordinary Share Capital 5400 5400 5400 Share Premium 3500 3500 3500 Revaluation Reserve 7125 8125 5550 Retained Earnings 19225 20225 17650 Total Capital 2 3 4 You are required to: Write a report that, calculates, compares and explains the changes in the following financial ratios for the years ended 2021 and 2020: (20 marks) A. Profitability ratios a. Net Profit Margin b. Return on Equity (ROE) (3 marks) (4 marks) B. Liquidity Ratios a. Acid Test Ratio (3 marks) C. Efficiency ratios a. Accounts Payables Collection Period (4 marks) D. Capital Structure Ratios a. Gearing Ratio (3 marks) b. Interest Cover (3 marks) You should use average figures where required (using also, where and if needed, figures from the year ended 2019). The marks for each ratio will be split in to three parts (approximately 1/3 for each year's ratio and 1/3 for the comparison, analysis, and explanation). You are required to: Write a report that, calculates, compares and explains the changes in the following financial ratios for the years ended 2021 and 2020: (20 marks) A. Profitability ratios a. Net Profit Margin b. Return on Equity (ROE) (3 marks) (4 marks) B. Liquidity Ratios a. Acid Test Ratio (3 marks) C. Efficiency ratios a. Accounts Payables Collection Period (4 marks) D. Capital Structure Ratios a. Gearing Ratio (3 marks) b. Interest Cover (3 marks) You should use average figures where required (using also, where and if needed, figures from the year ended 2019). The marks for each ratio will be split in to three parts (approximately 1/3 for each year's ratio and 1/3 for the comparison, analysis, and explanation). You are required to: Write a report that, calculates, compares and explains the changes in the following financial ratios for the years ended 2021 and 2020: (20 marks) A. Profitability ratios a. Net Profit Margin b. Return on Equity (ROE) (3 marks) (4 marks) B. Liquidity Ratios a. Acid Test Ratio (3 marks) C. Efficiency ratios a. Accounts Payables Collection Period (4 marks) D. Capital Structure Ratios a. Gearing Ratio (3 marks) b. Interest Cover (3 marks) You should use average figures where required (using also, where and if needed, figures from the year ended 2019). The marks for each ratio will be split in to three parts (approximately 1/3 for each year's ratio and 1/3 for the comparison, analysis, and explanation). Task 2 (25 marks) The purpose of this task is to compare the profitability, liquidity, efficiency and capital structure of Sizzling Plc for financial years ending 2021 and 2020 using the financial statements provided below. Sizzling Pic Statement of Financial Statement as at Note 2021 2020 2019 000* 000 000 S S S Non-Current Assets Intangible Assets 975 525 Property, Plant and equipment 12500 11000 9500 Fixtures and fittings 2500 2000 1500 Total NCA 15975 13525 11000 Current Assets Inventories 17000 14000 13000 Trade and other receivables 21000 19500 18400 Prepayments 3250 2375 925 Cash and cash equivalents/other 2500 5325 4325 Total CA 43750 41200 36650 I TOTAL ASSETS 59725 54725 47650 Non-Current Liabilities 10500 8500 6000 30000 26000 Current Liabilities 24000 40500 34500 30000 Total Liabilities 19225 20225 17650 NET ASSETS FINANCED BY 3200 3200 3200 Ordinary Share Capital 5400 5400 5400 Share Premium 3500 3500 3500 Revaluation Reserve 7125 8125 5550 Retained Earnings 19225 20225 17650 Total Capital 2 3 4
Step by Step Solution
There are 3 Steps involved in it

Get step-by-step solutions from verified subject matter experts