

Question: Please help Homework: 2.4 Question 1, 2.4-1 A graphical display of a data set is Relative Frequency given. Identify the overall shape of 0.30 the
Please help
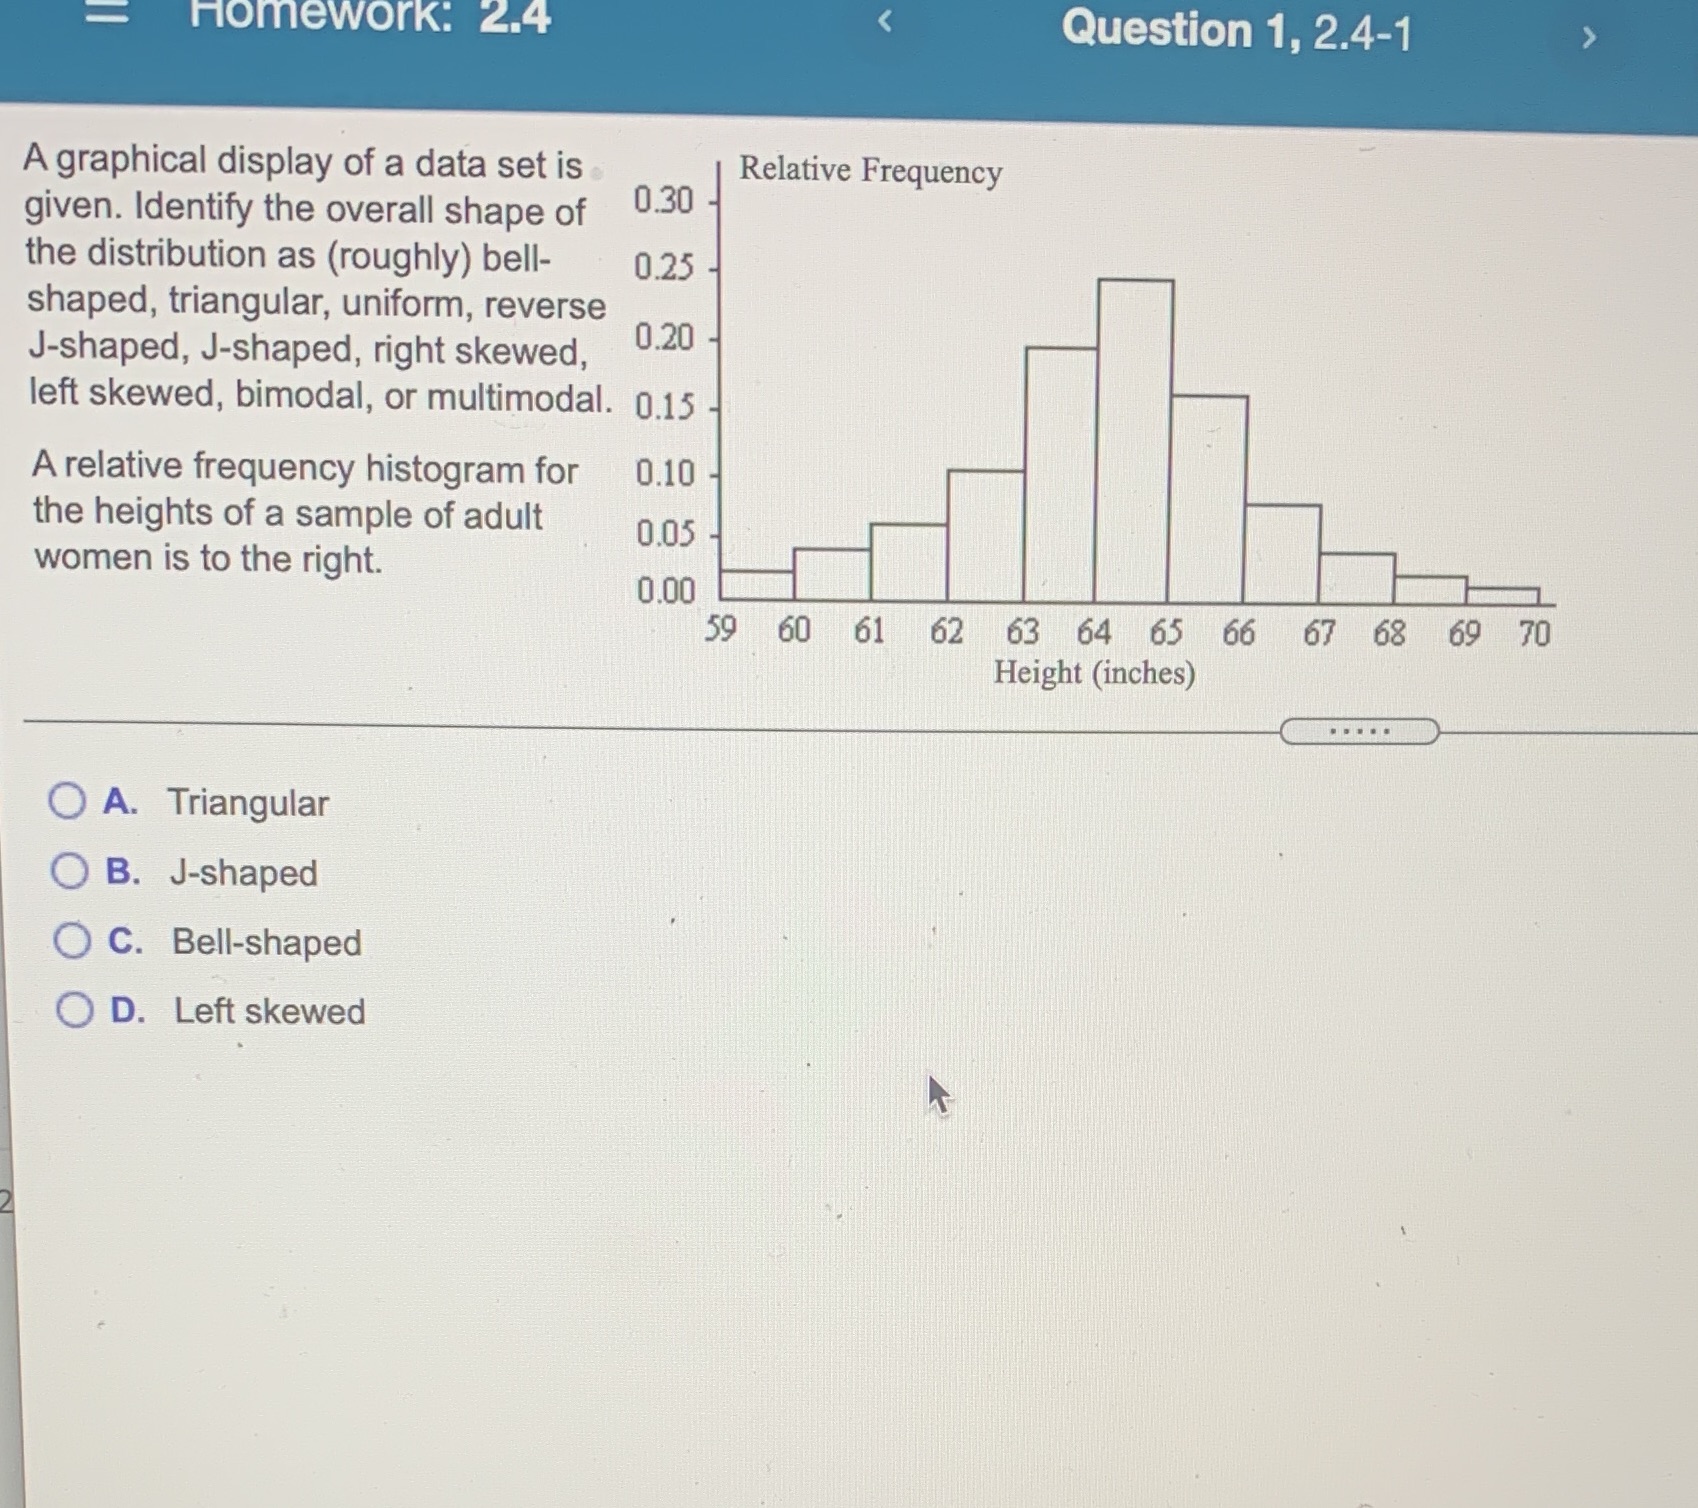
Homework: 2.4 Question 1, 2.4-1 A graphical display of a data set is Relative Frequency given. Identify the overall shape of 0.30 the distribution as (roughly) bell- 0.25 shaped, triangular, uniform, reverse J-shaped, J-shaped, right skewed, 0.20 left skewed, bimodal, or multimodal. 0.15 A relative frequency histogram for 0.10 the heights of a sample of adult 0.05 women is to the right. 0.00 59 60 61 62 63 64 65 66 67 68 69 70 Height (inches) . . . . . O A. Triangular O B. J-shaped O C. Bell-shaped O D. Left skewed
Step by Step Solution
There are 3 Steps involved in it
1 Expert Approved Answer
Step: 1 Unlock

Question Has Been Solved by an Expert!
Get step-by-step solutions from verified subject matter experts
Step: 2 Unlock
Step: 3 Unlock