

Question: please help i already asked for this but it gor never answered and was marked as answers. please help ASAP thbak u Fuel consumption is
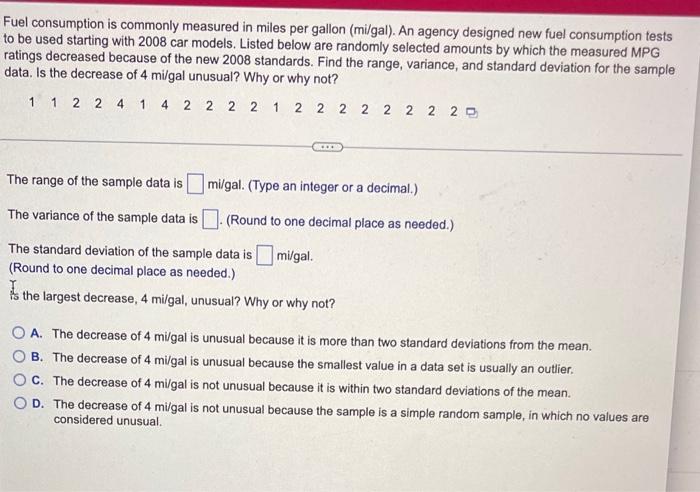
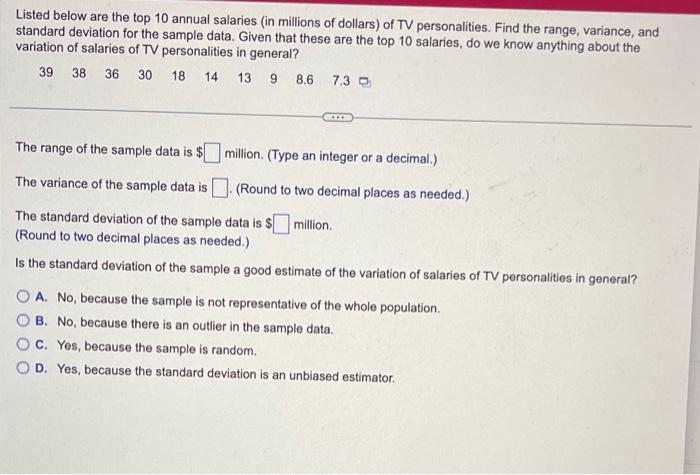
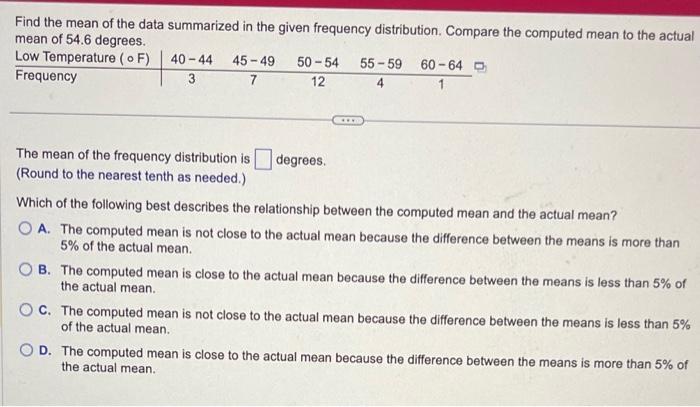
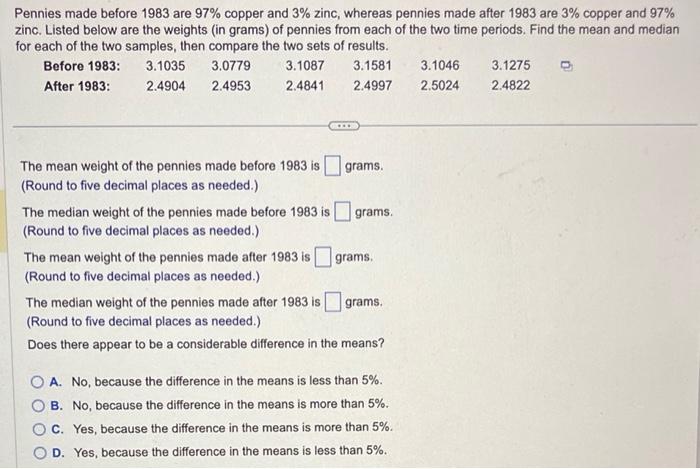
Fuel consumption is commonly measured in miles per gallon (mi/gal). An agency designed new fuel consumption tests to be used starting with 2008 car models. Listed below are randomly selected amounts by which the measured MPG ratings decreased because of the new 2008 standards. Find the range, variance, and standard deviation for the sample data. Is the decrease of 4mi/gal unusual? Why or why not? The range of the sample data is milgal. (Type an integer or a decimal.) The variance of the sample data is (Round to one decimal place as needed.) The standard deviation of the sample data is mi/gal. (Round to one decimal place as needed.) It the largest decrease, 4 milgal, unusual? Why or why not? A. The decrease of 4mi/gal is unusual because it is more than two standard deviations from the mean. B. The decrease of 4mi/gal is unusual because the smallest value in a data set is usually an outlier. C. The decrease of 4mi/gal is not unusual because it is within two standard deviations of the mean. D. The decrease of 4mi/gal is not unusual because the sample is a simple random sample, in which no values are considered unusual. Listed below are the top 10 annual salaries (in millions of dollars) of TV personalities. Find the range, variance, and standard deviation for the sample data. Given that these are the top 10 salaries, do we know anything about the variation of salaries of TV personalities in general? The range of the sample data is $ million. (Type an integer or a decimal.) The variance of the sample data is (Round to two decimal places as needed.) The standard deviation of the sample data is $ million. (Round to two decimal places as needed.) Is the standard deviation of the sample a good estimate of the variation of salaries of TV personalities in general? A. No, because the sample is not representative of the whole population. B. No, because there is an outlier in the sample data. C. Yes, because the sample is random. D. Yes, because the standard deviation is an unbiased estimator. Find the mean of the data summarized in the given frequency distribution. Compare the computed mean to the actual mean of 54.6 degrees. The mean of the frequency distribution is degrees. (Round to the nearest tenth as needed.) Which of the following best describes the relationship between the computed mean and the actual mean? A. The computed mean is not close to the actual mean because the difference between the means is more than 5% of the actual mean. B. The computed mean is close to the actual mean because the difference between the means is less than 5% of the actual mean. C. The computed mean is not close to the actual mean because the difference between the means is less than 5% of the actual mean. D. The computed mean is close to the actual mean because the difference between the means is more than 5% of the actual mean. Pennies made before 1983 are 97% copper and 3% zinc, whereas pennies made after 1983 are 3% copper and 97% zinc. Listed below are the weights (in grams) of pennies from each of the two time periods. Find the mean and median for each of the two samples, then compare the two sets of results. The mean weight of the pennies made before 1983 is grams. (Round to five decimal places as needed.) The median weight of the pennies made before 1983 is grams. (Round to five decimal places as needed.) The mean weight of the pennies made after 1983 is grams. (Round to five decimal places as needed.) The median weight of the pennies made after 1983 is grams. (Round to five decimal places as needed.) Does there appear to be a considerable difference in the means? A. No, because the difference in the means is less than 5%. B. No, because the difference in the means is more than 5%. C. Yes, because the difference in the means is more than 5%. D. Yes, because the difference in the means is less than 5%
Step by Step Solution
There are 3 Steps involved in it

Get step-by-step solutions from verified subject matter experts