

Question: Please help? I am stuck on this one problem. Thank you 3. The chart to the right is the raw data of the MI of
Please help? I am stuck on this one problem. Thank you
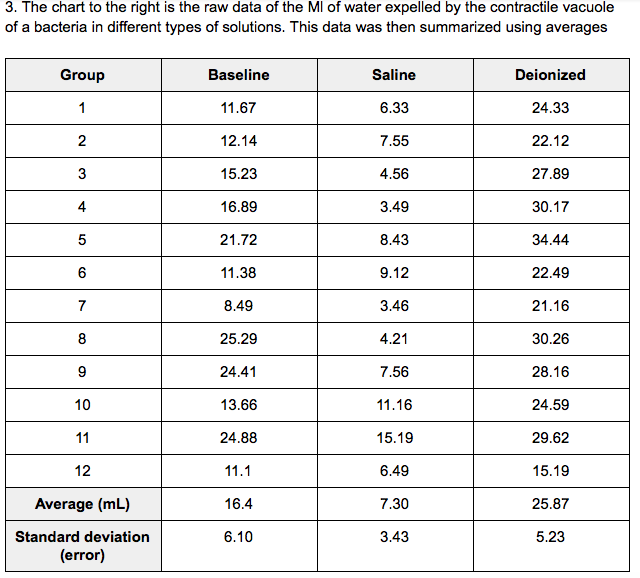
3. The chart to the right is the raw data of the MI of water expelled by the contractile vacuole of a bacteria in different types of solutions. This data was then summarized using averages Group Baseline Saline Deionized 11.67 6.33 24.33 2 12.14 7.55 22.12 3 15.23 4.56 27.89 4 16.89 3.49 30.17 5 21.72 8.43 34.44 6 11.38 9.12 22.49 7 8.49 3.46 21.16 8 25.29 4.21 30.26 9 24.41 7.56 28.16 10 13.66 11.16 24.59 11 24.88 15.19 29.62 12 11.1 6.49 15.19 Average (mL) 16.4 7.30 25.87 Standard deviation 6.10 3.43 5.23 (error)
Step by Step Solution
There are 3 Steps involved in it
1 Expert Approved Answer
Step: 1 Unlock

Question Has Been Solved by an Expert!
Get step-by-step solutions from verified subject matter experts
Step: 2 Unlock
Step: 3 Unlock