Question: Please help i had to repost cause the first two times the picture wasnt clear enough. (ignore the letters) PLEASE SHOW WORK ON EXCEL AND

Please help i had to repost cause the first two times the picture wasnt clear enough. (ignore the letters) PLEASE SHOW WORK ON EXCEL AND BE SPECIFIC. I will rate x2 please i beg i need help
Please help i had to repost cause the first two
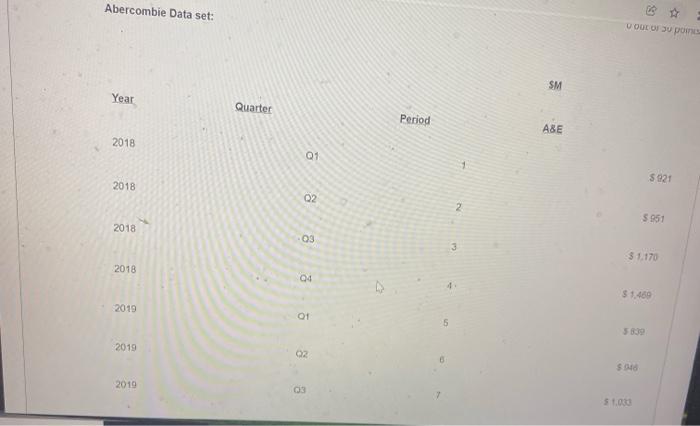
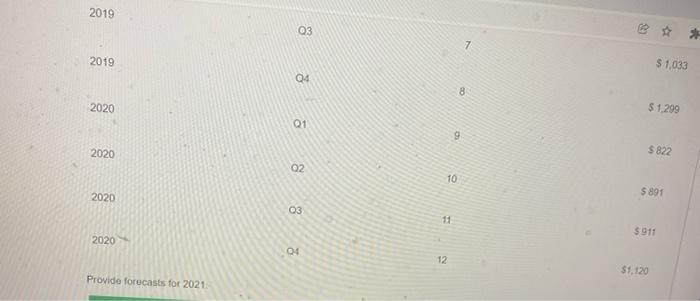
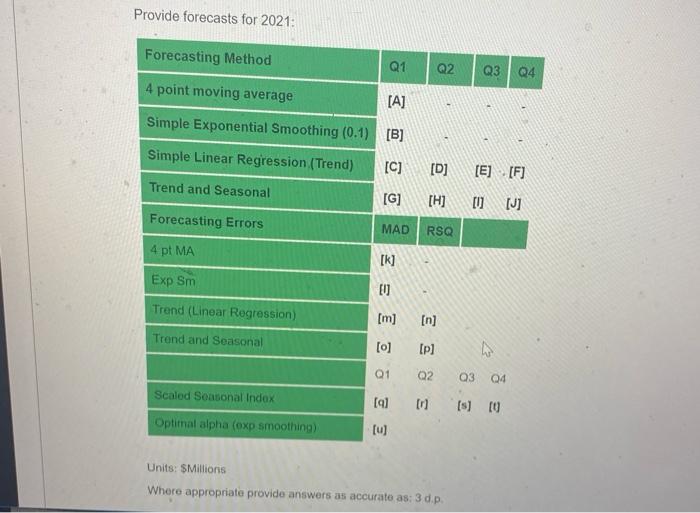
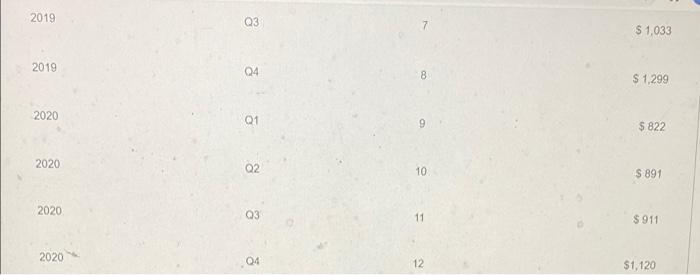
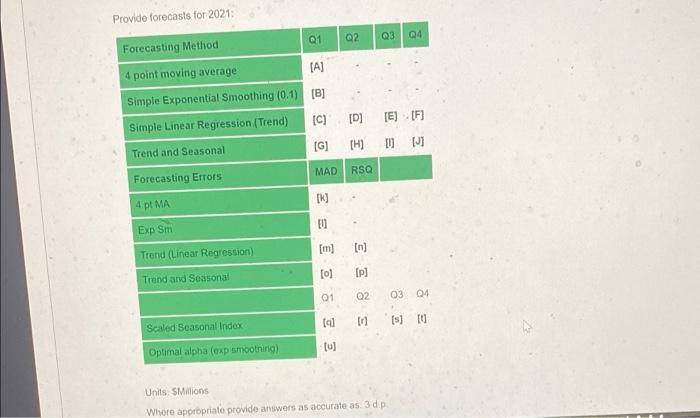
the excel data is the first 3 screenshots
the first two pictures are the data!!!! please show work i beg. i will rate 2X Please help i had to repost cause the first two
Please help i had to repost cause the first two
Abercombie Data set: OUE O su pom SM Year Quarter Period AXE 2018 0 Q1 5921 2018 02 2 5951 2018 03 3 $ 1.170 2018 04 4 $ 1469 2019 01 82 5 5839 2019 2019 1.03 2019 03 7 2019 $ 1,033 8 2020 $ 1.299 01 2020 $ 822 2 10 2020 $891 8 03 11 $911 2020 04 12 $1,120 Provide forecasts for 2021 Provide forecasts for 2021: Forecasting Method Q1 Q2 Q3 Q4 4 point moving average [A] Simple Exponential Smoothing (0.1) [B] Simple Linear Regression (Trend) [C] [D] [E] [F] Trend and Seasonal [G] [H] [U] [J] Forecasting Errors MAD RS 4 pt MA [k] Exp Sm Trend (Linear Regression) [m] [n] Trond and Seasonal [o] [p] ho E E 3 Q1 02 03 Q4 Scaled Seasonal Index = = [9 [s] (0 Optimal alpha (oxp smoothing) [] Units: SMillions Where appropriate provide answers as accurate as: 3 d.p. OULOUP stion 1 Abercombie Data set: SM Year A&E Quarter Period S 921 2018 Q1 2 $ 951 2018 02 $ 1,170 2018 03 S 1.469 04 4 2018 S 839 2019 01 6 5 946 2019 02 2019 Q3 7 S 1,033 2019 Q4 8 $ 1,299 2020 Q1 9 $ 822 2020 02 10 S 891 2020 Q3 11 $ 911 2020 04 12 $1,120 Provide forecasts for 2021 Q1 02 Q3 04 [A] Forecasting Method 4 point moving average Simple Exponential Smoothing (0.1) Simple Linear Regression (Trend) [B] IC) [D] [E] [F] [G] [H] [J] Trend and Seasonal MAD RSQ 2 Forecasting Errors IK) 4 pt MA Exp Sm [m] Trond (Linear Regression) Trend and Seasonal 10] SE3 01 03 04 tal Scaled Seasonal Index Is) 0 Optimal alpha (exp smoothing) [u] Units SMillions Where appropriate provide answers as accurate as 3d Abercombie Data set: OUE O su pom SM Year Quarter Period AXE 2018 0 Q1 5921 2018 02 2 5951 2018 03 3 $ 1.170 2018 04 4 $ 1469 2019 01 82 5 5839 2019 2019 1.03 2019 03 7 2019 $ 1,033 8 2020 $ 1.299 01 2020 $ 822 2 10 2020 $891 8 03 11 $911 2020 04 12 $1,120 Provide forecasts for 2021 Provide forecasts for 2021: Forecasting Method Q1 Q2 Q3 Q4 4 point moving average [A] Simple Exponential Smoothing (0.1) [B] Simple Linear Regression (Trend) [C] [D] [E] [F] Trend and Seasonal [G] [H] [U] [J] Forecasting Errors MAD RS 4 pt MA [k] Exp Sm Trend (Linear Regression) [m] [n] Trond and Seasonal [o] [p] ho E E 3 Q1 02 03 Q4 Scaled Seasonal Index = = [9 [s] (0 Optimal alpha (oxp smoothing) [] Units: SMillions Where appropriate provide answers as accurate as: 3 d.p. OULOUP stion 1 Abercombie Data set: SM Year A&E Quarter Period S 921 2018 Q1 2 $ 951 2018 02 $ 1,170 2018 03 S 1.469 04 4 2018 S 839 2019 01 6 5 946 2019 02 2019 Q3 7 S 1,033 2019 Q4 8 $ 1,299 2020 Q1 9 $ 822 2020 02 10 S 891 2020 Q3 11 $ 911 2020 04 12 $1,120 Provide forecasts for 2021 Q1 02 Q3 04 [A] Forecasting Method 4 point moving average Simple Exponential Smoothing (0.1) Simple Linear Regression (Trend) [B] IC) [D] [E] [F] [G] [H] [J] Trend and Seasonal MAD RSQ 2 Forecasting Errors IK) 4 pt MA Exp Sm [m] Trond (Linear Regression) Trend and Seasonal 10] SE3 01 03 04 tal Scaled Seasonal Index Is) 0 Optimal alpha (exp smoothing) [u] Units SMillions Where appropriate provide answers as accurate as 3d

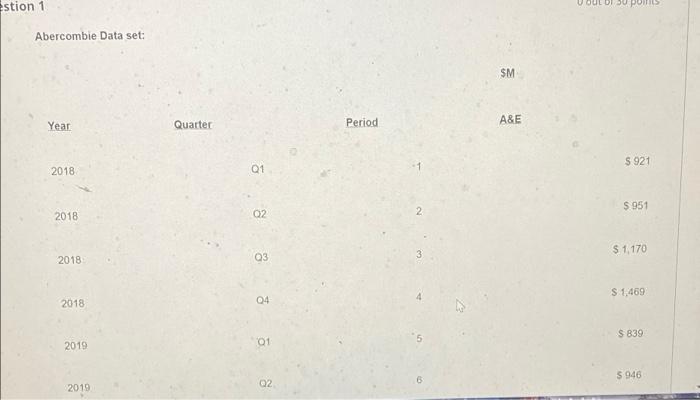
Step by Step Solution

There are 3 Steps involved in it

1 Expert Approved Answer
Step: 1 Unlock blur-text-image
Question Has Been Solved by an Expert!

Get step-by-step solutions from verified subject matter experts

Step: 2 Unlock
Step: 3 Unlock

Students Have Also Explored These Related General Management Questions!