

Question: Please Help! I need assistance using the listed quadratic trend equation to make numerical forecast for the next three years and completing the chart in
Please Help! I need assistance using the listed quadratic trend equation to make numerical forecast for the next three years and completing the chart in question "b" using the information provided only
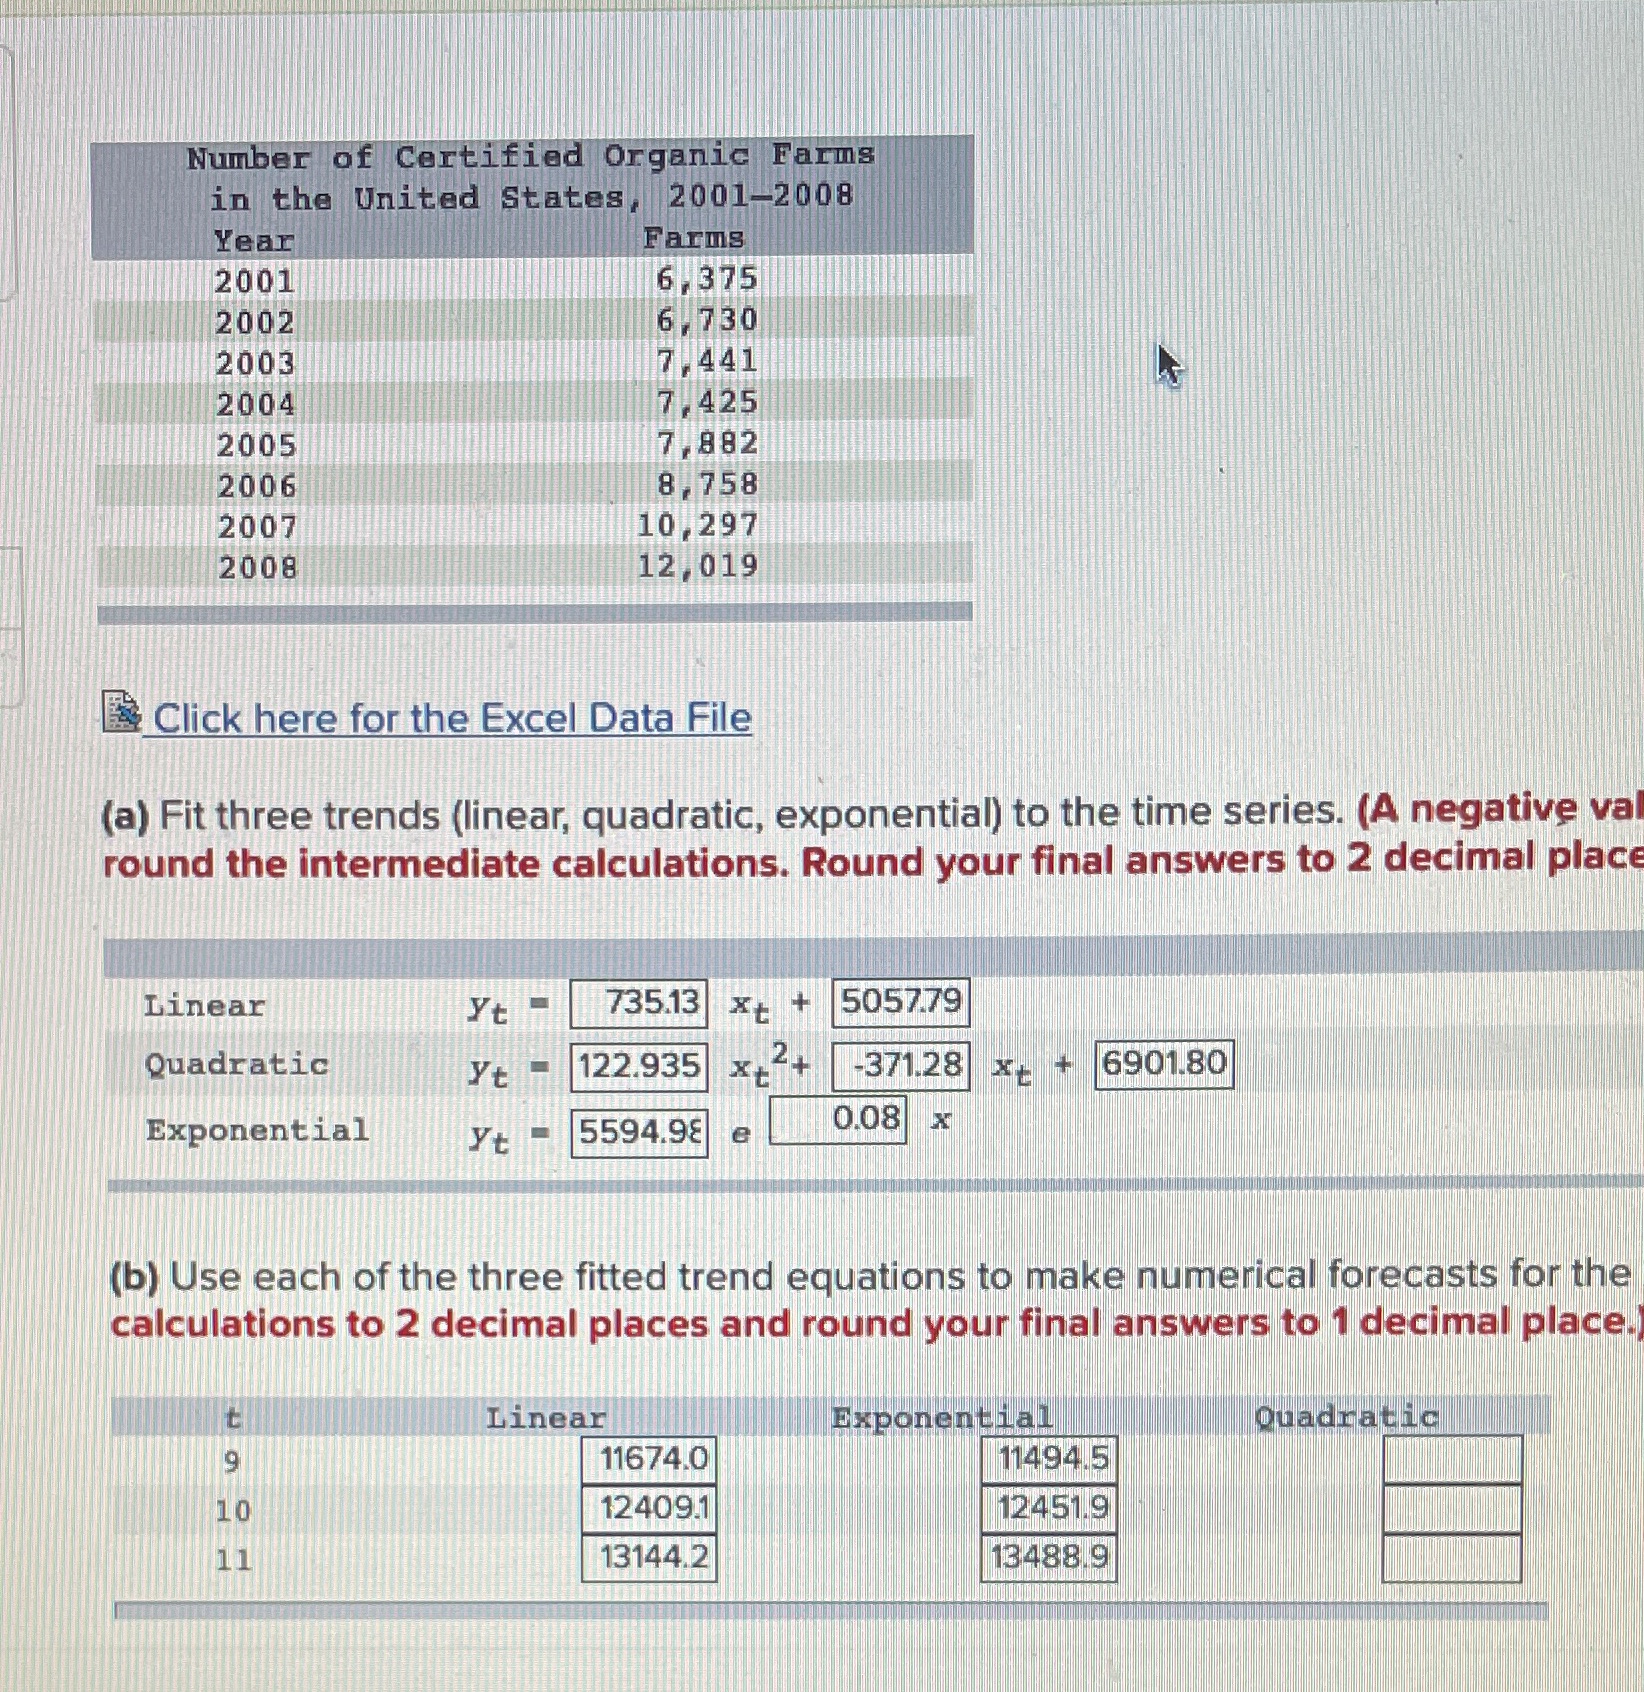
Number of Certified Organic Farms in the United States, 2001-2008 Year Farms 2001 6, 375 2002 6, 730 2003 7441 2004 7,425 2005 7 882 2006 8, 758 2007 10, 297 2008 12 , 019 Click here for the Excel Data File (a) Fit three trends (linear, quadratic, exponential) to the time series. (A negative val round the intermediate calculations. Round your final answers to 2 decimal place Linear 735.13 Xt 5057.79 Quadratic Yt 122.935 Xt -371.28 6901.80 Exponential 5594.98 0.08 (b) Use each of the three fitted trend equations to make numerical forecasts for the calculations to 2 decimal places and round your final answers to 1 decimal place. t Linear Exponential Quadratic 11674.0 11494.5 10 12409.1 12451.9 11 13144.2 13488.9
Step by Step Solution
There are 3 Steps involved in it

Get step-by-step solutions from verified subject matter experts