

Question: Please help I need section 3 SECTION 1 (Amounts in millions - except per share) Net Sales Net Income 15,9323,03414,4552,694 Inventories Quick assets Total Assets
Please help I need section 3
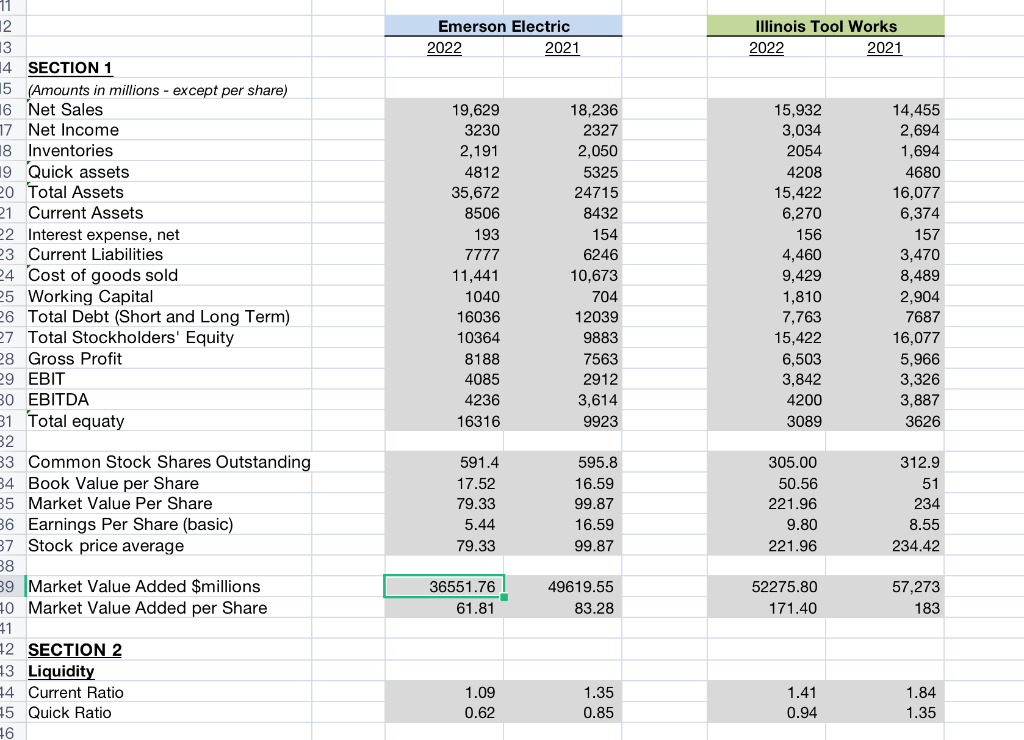
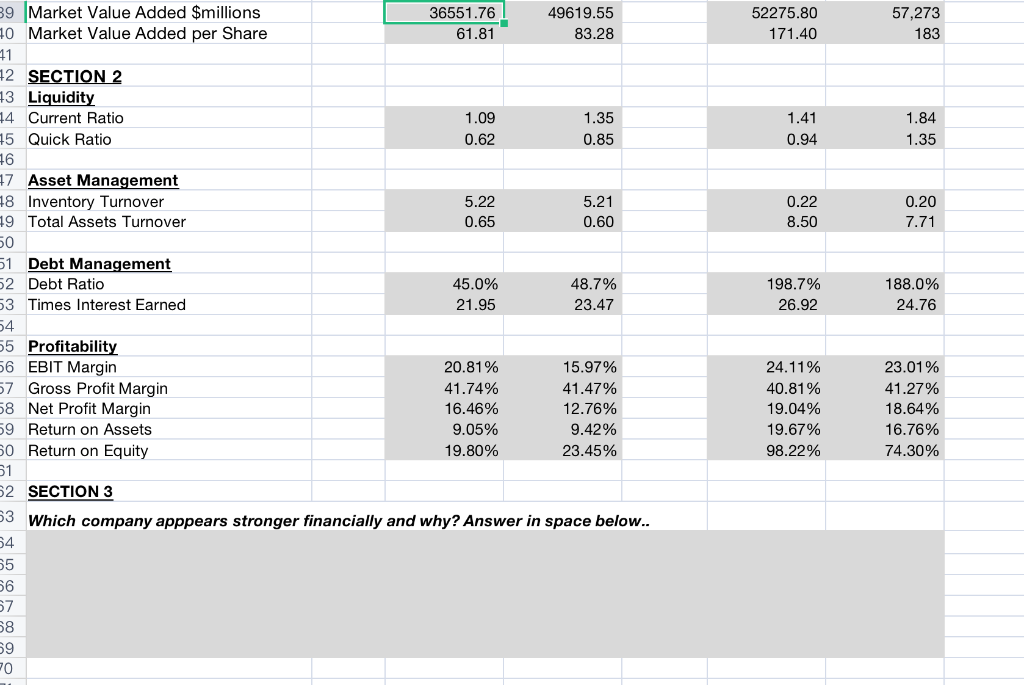
SECTION 1 (Amounts in millions - except per share) Net Sales Net Income 15,9323,03414,4552,694 Inventories Quick assets Total Assets Current Assets Interest expense, net Current Liabilities Cost of goods sold Working Capital Total Debt (Short and Long Term) Total Stockholders' Equity Gross Profit EBIT EBITDA Total equaty 19,62932302,191481235,6728506193777711,441104016036103648188408542361631618,23623272,0505325247158432154624610,673704120399883756329123,6149923 Common Stock Shares Outstanding Book Value per Share Market Value Per Share Earnings Per Share (basic) Stock price average \begin{tabular}{rr} 305.00 & 312.9 \\ 50.56 & 51 \\ 221.96 & 234 \\ 9.80 & 8.55 \\ 221.96 & 234.42 \\ \hline \end{tabular} Market Value Added \$millions Market Value Added per Share \begin{tabular}{rr} 591.4 & 595.8 \\ 17.52 & 16.59 \\ 79.33 & 99.87 \\ 5.44 & 16.59 \\ 79.33 & 99.87 \\ \hline 36551.76 & 49619.55 \\ \hline 61.81 & 83.28 \\ \hline \end{tabular} SECTION 2 Liquidity Current Ratio Quick Ratio 6 Market Value Added \$millions Market Value Added per Share SECTION 2 Liquidity Current Ratio Quick Ratio \begin{tabular}{|l|l|l|l} \hline 1.09 & 1.35 & 1.41 & 1.84 \\ \hline 0.62 & 0.85 & 0.94 & 1.35 \\ \hline \end{tabular} Asset Management Inventory Turnover Total Assets Turnover 5.220.655.210.60 Debt Management Debt Ratio Times Interest Earned Profitability EBIT Margin Gross Profit Margin Net Profit Margin Return on Assets Return on Equity SECTION 3 Which company apppears stronger financially and why? Answer in space below
Step by Step Solution
There are 3 Steps involved in it

Get step-by-step solutions from verified subject matter experts