

Question: please help! I only need the boxes under all the data so # 2 ( and #3 for the second image) for all of them.
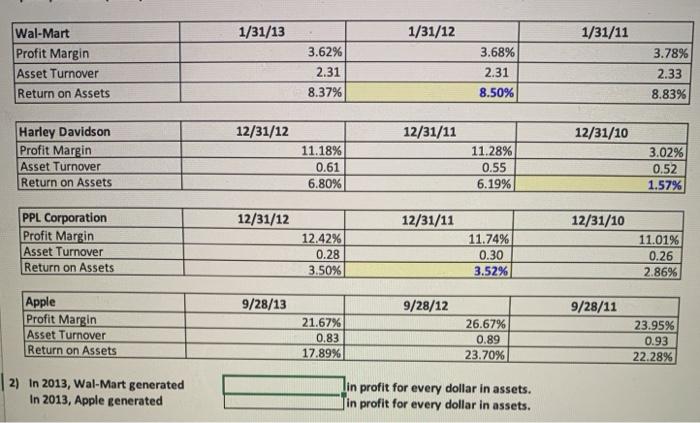
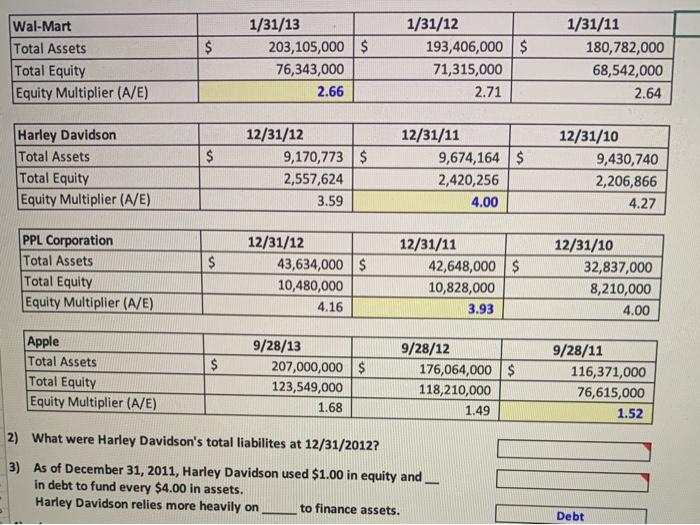
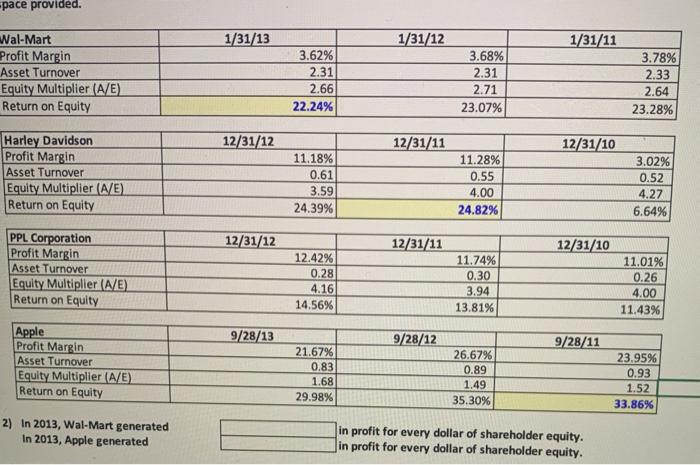
1/31/13 1/31/12 1/31/11 Wal-Mart Profit Margin Asset Turnover Return on Assets 3.62% 2.31 8.37% 3.68% 2.31 8.50% 3.78% 2.33 8.83% 12/31/12 12/31/11 12/31/10 Harley Davidson Profit Margin Asset Turnover Return on Assets 11.18% 0.61 6.80% 11.28% 0.55 6.19% 3.02% 0.52 1.57% 12/31/12 12/31/11 12/31/10 PPL Corporation Profit Margin Asset Turnover Return on Assets 12.42% 0.28 3.50% 11.74% 0.30 3.52% 11.01% 0.26 2.86% 9/28/13 9/28/12 9/28/11 Apple Profit Margin Asset Turnover Return on Assets 21.67% 0.83 17.89% 26.67% 0.89 23.70% 23.95% 0.93 22.28% 2) In 2013, Wal-Mart generated In 2013, Apple generated Din profit for every dollar in assets. in profit for every dollar in assets. $ Wal-Mart Total Assets Total Equity Equity Multiplier (A/E) 1/31/13 203,105,000 $ 76,343,000 2.66 1/31/12 193,406,000$ 71,315,000 2.71 1/31/11 180,782,000 68,542,000 2.64 $ Harley Davidson Total Assets Total Equity Equity Multiplier (A/E) 12/31/12 9,170,773 $ 2,557,624 12/31/11 9,674,164 $ 2,420,256 4.00 12/31/10 9,430,740 2,206,866 4.27 3.59 $ PPL Corporation Total Assets Total Equity Equity Multiplier (A/E) 12/31/12 43,634,000 $ 10,480,000 4.16 12/31/11 42,648,000$ 10,828,000 3.93 12/31/10 32,837,000 8,210,000 4.00 $ Apple Total Assets Total Equity Equity Multiplier (A/E) 9/28/13 207,000,000 $ 123,549,000 1.68 9/28/12 176,064,000$ 118,210,000 1.49 9/28/11 116,371,000 76,615,000 1.52 2) What were Harley Davidson's total liabilites at 12/31/2012? 3) As of December 31, 2011, Harley Davidson used $1.00 in equity and in debt to fund every $4.00 in assets. Harley Davidson relies more heavily on to finance assets. Debt -pace provided. 1/31/13 1/31/12 1/31/11 Wal-Mart Profit Margin Asset Turnover Equity Multiplier (A/E) Return on Equity 3.62% 2.31 2.66 22.24% 3.68% 2.31 2.71 23.07% 3.78% 2.33 2.64 23.28% 12/31/12 12/31/11 12/31/10 Harley Davidson Profit Margin Asset Turnover Equity Multiplier (AE) Return on Equity 11.18% 0.61 3.59 24.39% 11.28% 0.55 4.00 24.82% 3.02% 0.52 4.27 6.64% 12/31/12 12/31/11 12/31/10 PPL Corporation Profit Margin Asset Turnover Equity Multiplier (A/E) Return on Equity 12.42% 0.28 4.16 14.56% 11.74% 0.30 3.94 13.81% 11.01% 0.26 4.00 11.43% 9/28/13 9/28/12 9/28/11 Apple Profit Margin Asset Turnover Equity Multiplier (A/E) Return on Equity 21.67% 0.83 1.68 29.98% 26.67% 0.89 1.49 35.30% 23.95% 0.93 1.52 33.86% 2) In 2013, Wal-Mart generated In 2013, Apple generated in profit for every dollar of shareholder equity. in profit for every dollar of shareholder equity
Step by Step Solution
There are 3 Steps involved in it

Get step-by-step solutions from verified subject matter experts