

Question: Please help! I will give a thumbs up and positive review if you can help me with all!!!!! The following table shows nominal GDP and

Please help! I will give a thumbs up and positive review if you can help me with all!!!!!
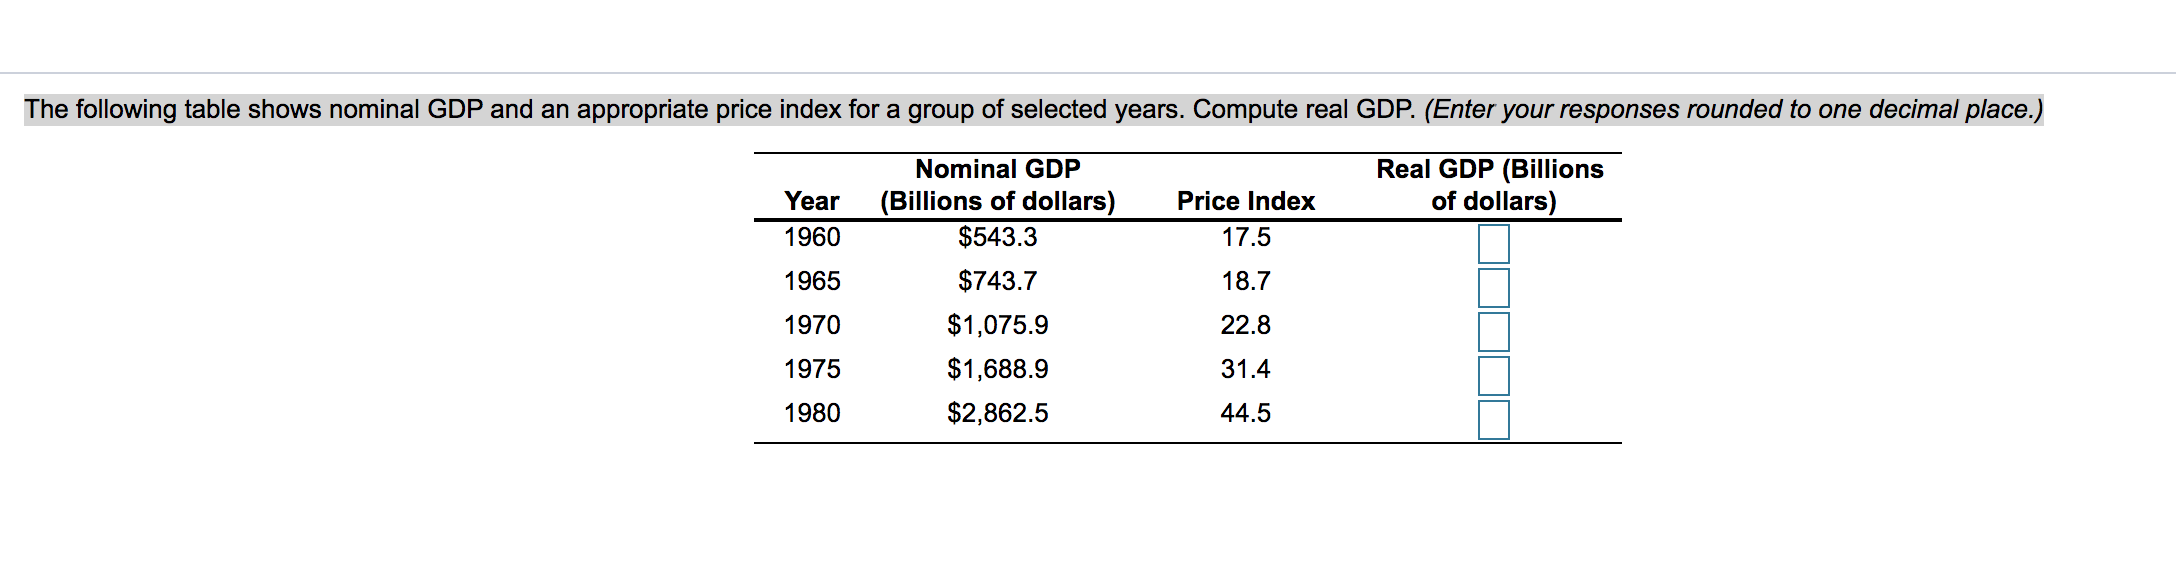


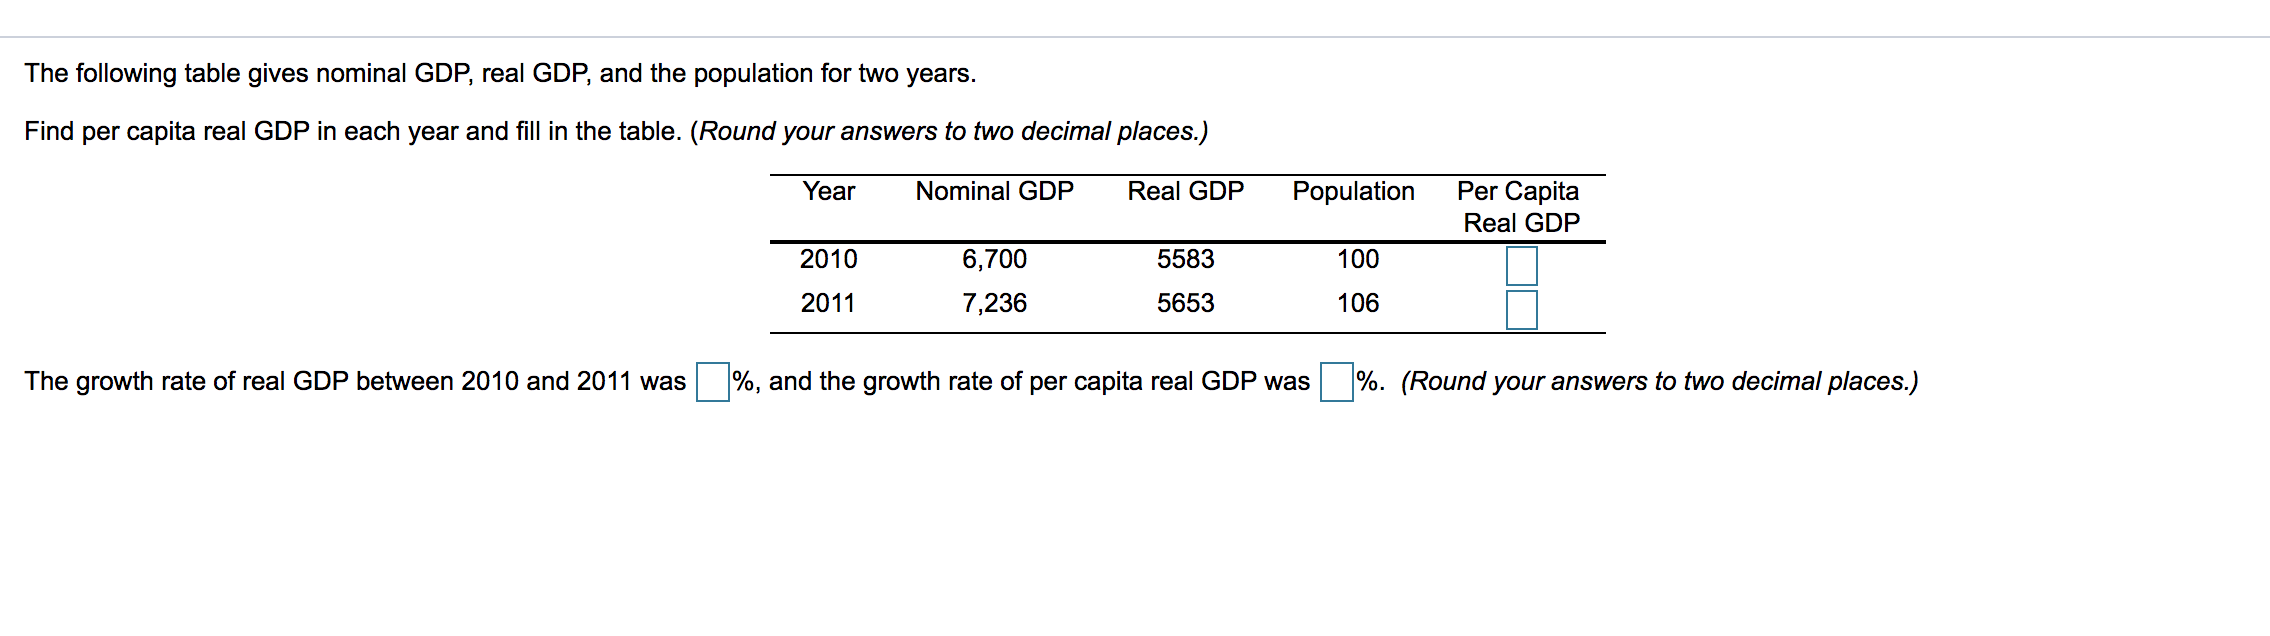
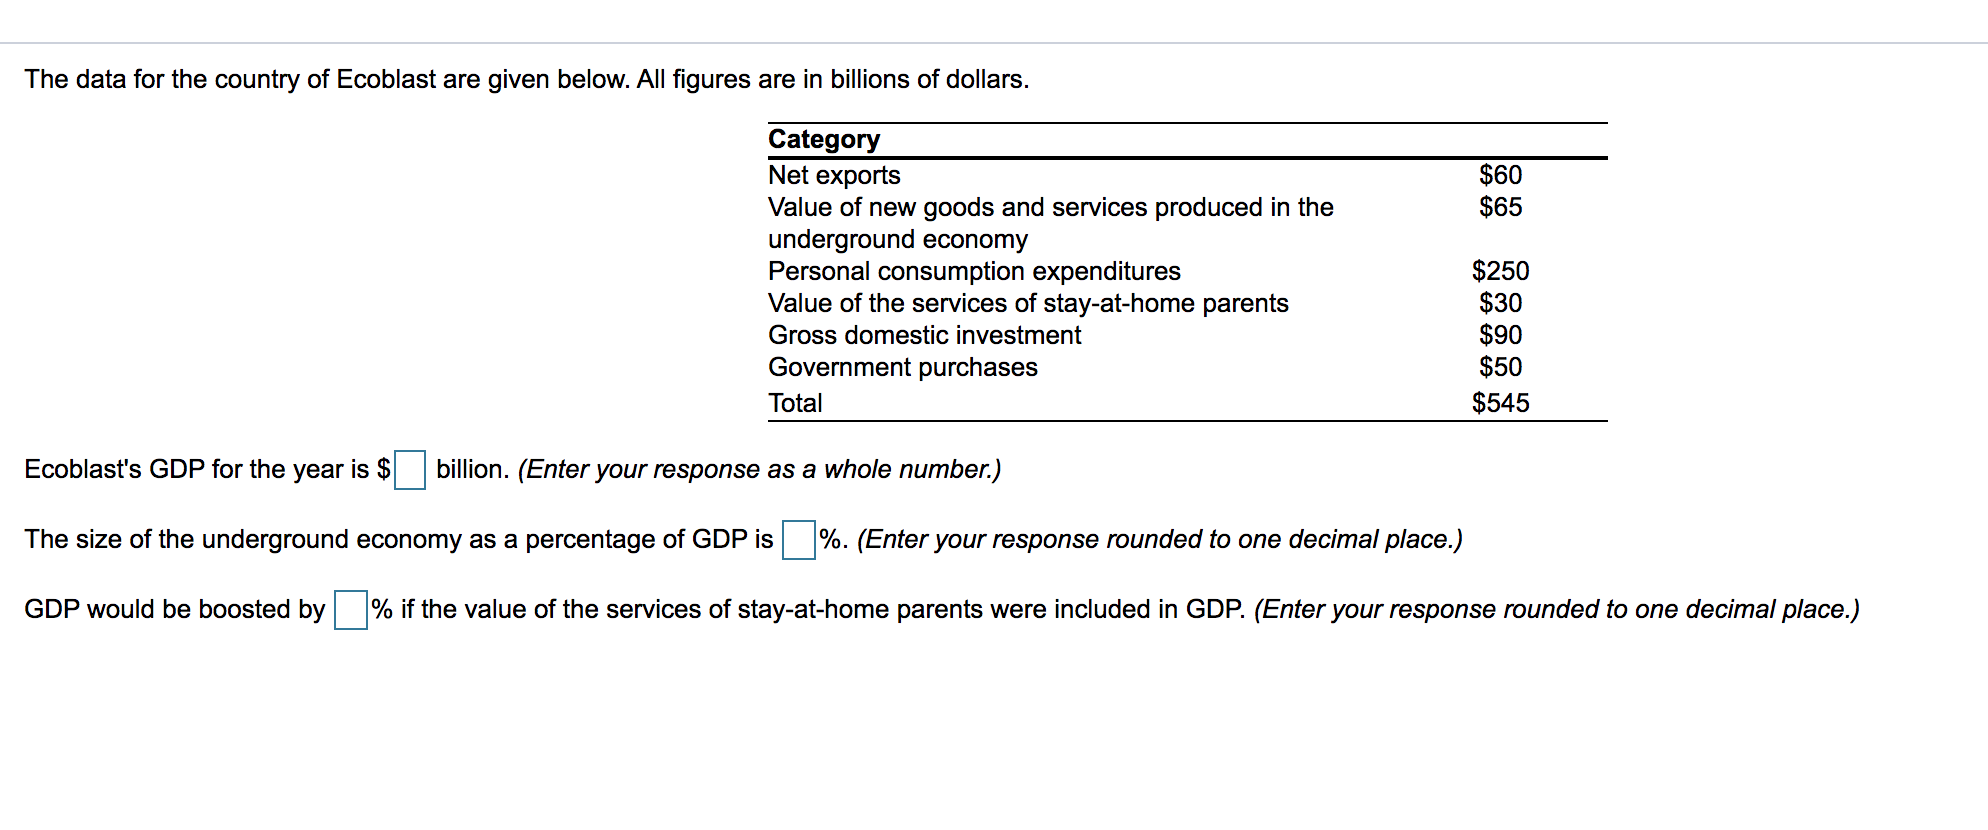
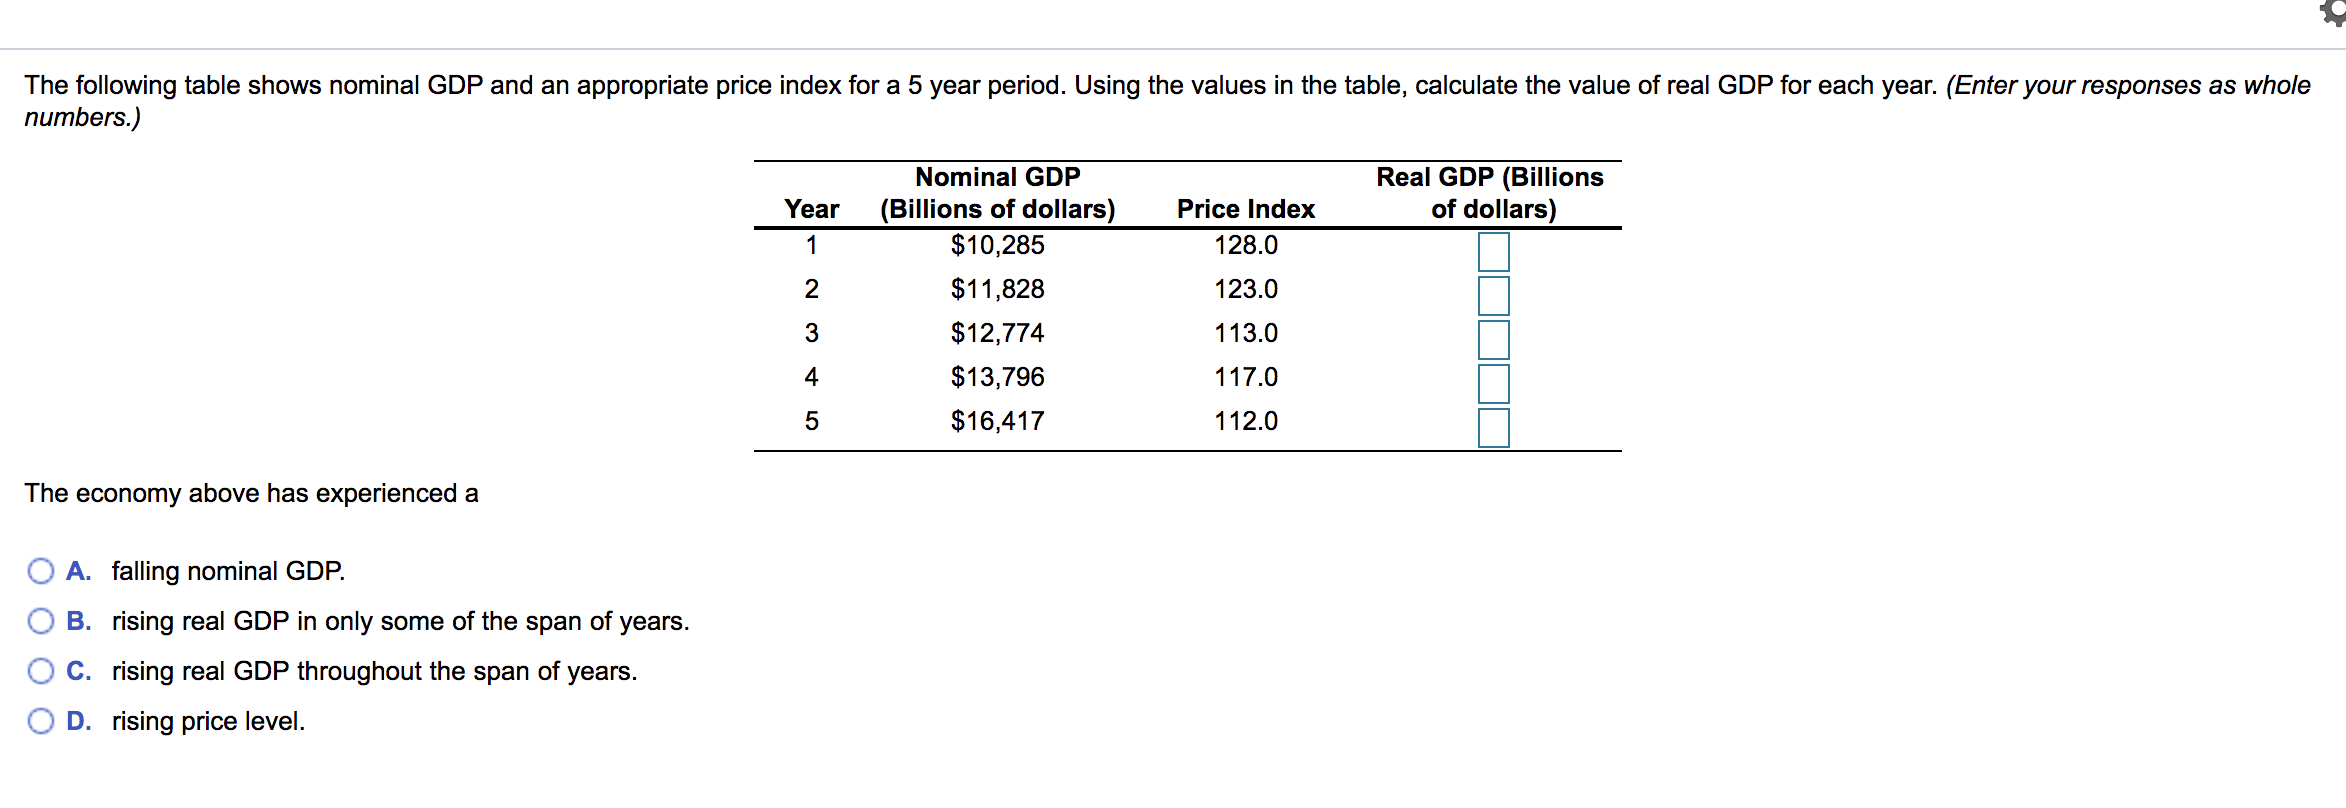
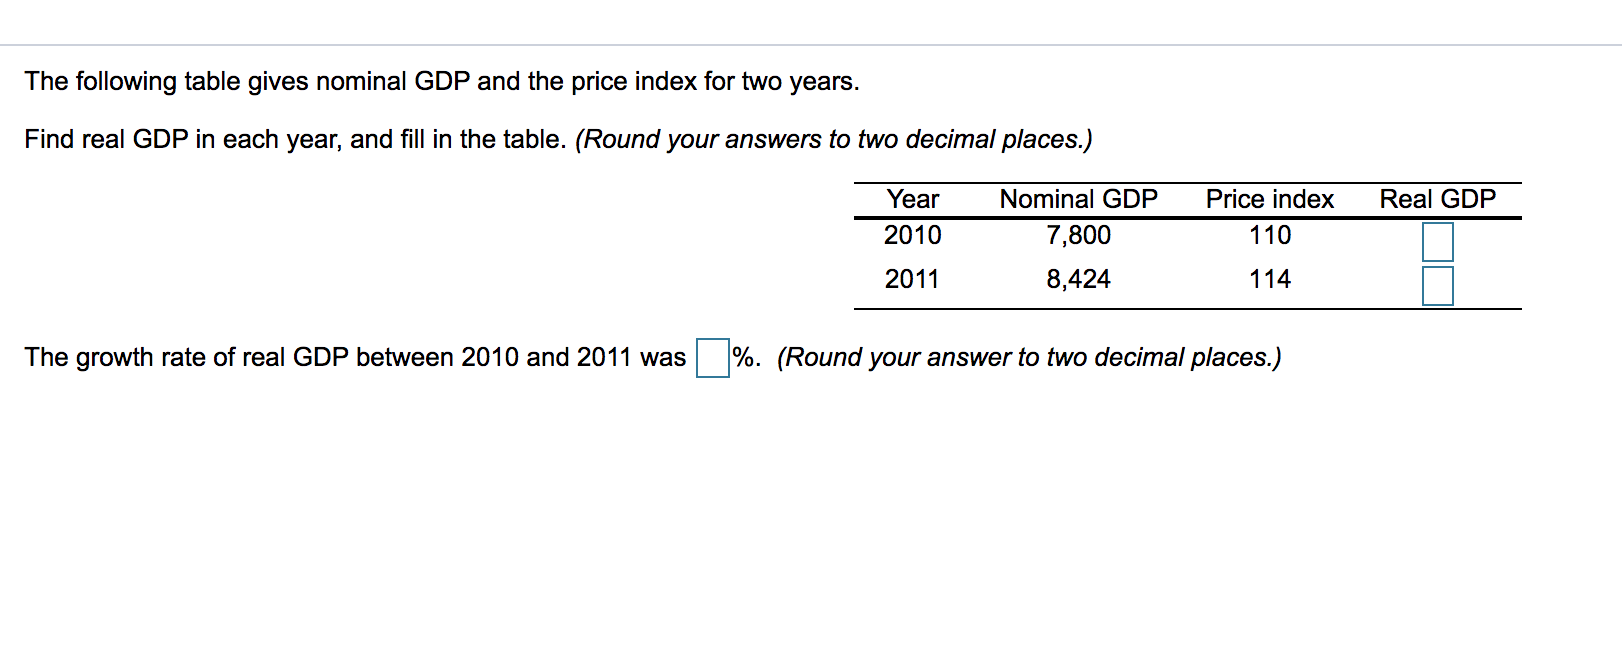
The following table shows nominal GDP and an appropriate price index for a group of selected years. Compute real GDP. (Enter your responses rounded to one decimal place.) Nominal GDP Real GDP (Billions Year (Billions of dollars) Price Index of dollars) 1960 $543.3 17.5 1965 $743.7 18.7 _ 1970 $1 ,075.9 22.8 1975 $1 ,688.9 31.4 1980 $2,862.5 44.5 The data for the country of Ecoblast are given below. All gures are in billions of dollars. Category Net exports $60 Value of new goods and services produced in the $65 underground economy Personal consumption expenditures $250 Value of the services of stay-at-home parents $30 Gross domestic investment $90 Government purchases $50 Total $545 Ecoblast's GDP for the year is $5 billion. (Enter your response as a whole number.) The size of the underground economy as a percentage of GDP is %. (Enter your response rounded to one decimal place.) GDP would be boosted by % if the value of the services of stay-at-home parents were included in GDP. (Enter your response rounded to one decimal place.) ii The following table shows nominal GDP and an appropriate price index for a 5 year period. Using the values in the table, calculate the value of real GDP for each year. (Enter your responses as whole numbers.) Nominal GDP Real GDP (Billions Year (Billions of dollars) Price Index of dollars) 1 $10,285 128.0 :I 2 $1 1,828 123.0 :I 3 $12,774 1 13.0 :I 4 $13,796 1 17.0 :I 5 $16,417 1 12.0 :I The economy above has experienced a O A. falling nominal GDP. 0 B. rising real GDP in only some of the span of years. 0 C. rising real GDP throughout the span of years. O D. rising price level. The following table gives nominal GDP and the price index for two years. Find real GDP in each year, and ll in the table. (Round your answers to two decimal places.) Year Nominal GDP Price index Real GDP 2010 7,800 110 D 2011 8,424 114 D The growth rate of real GDP between 2010 and 2011 was |:|%. (Round your answer to two decimal places.) The following table gives nominal GDP, real GDP, and the population for two years. Find per capita real GDP in each year and fill in the table. (Round your answers to two decimal places.) Year Nominal GDP Real GDP Population Per Capita Real GDP 2010 6,700 5583 100 2011 7,236 5653 106 The growth rate of real GDP between 2010 and 2011 was %, and the growth rate of per capita real GDP was %. (Round your answers to two decimal places.)
Step by Step Solution
There are 3 Steps involved in it

Get step-by-step solutions from verified subject matter experts