

Question: Please help!!! I will give a thumbs up right away when the answer is correct and answered fast!! CH 14: Graded Homework Question 11 of
Please help!!! I will give a thumbs up right away when the answer is correct and answered fast!!
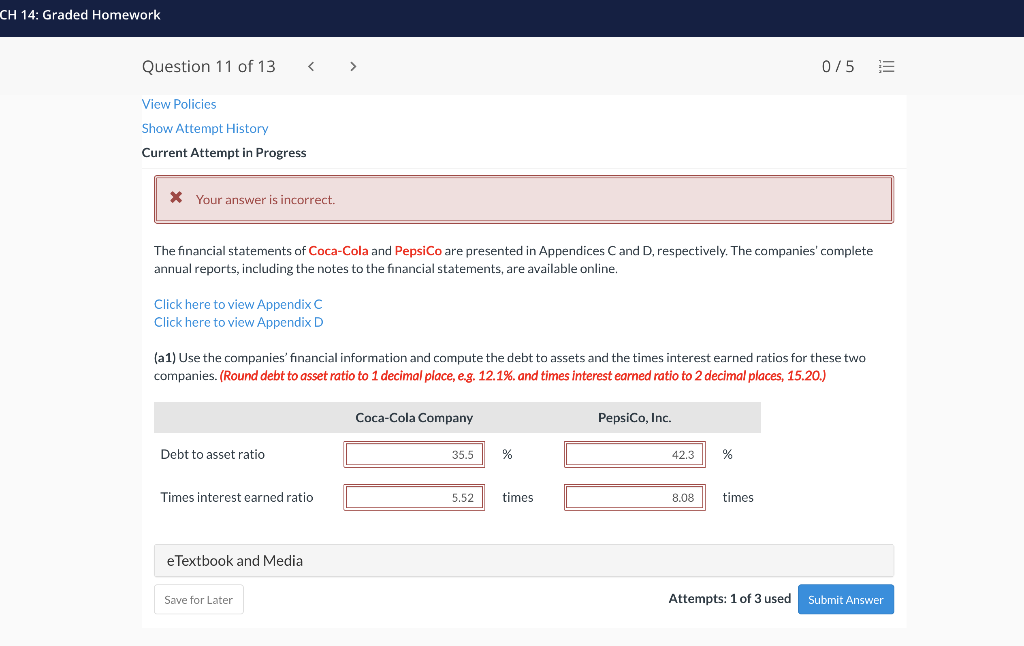
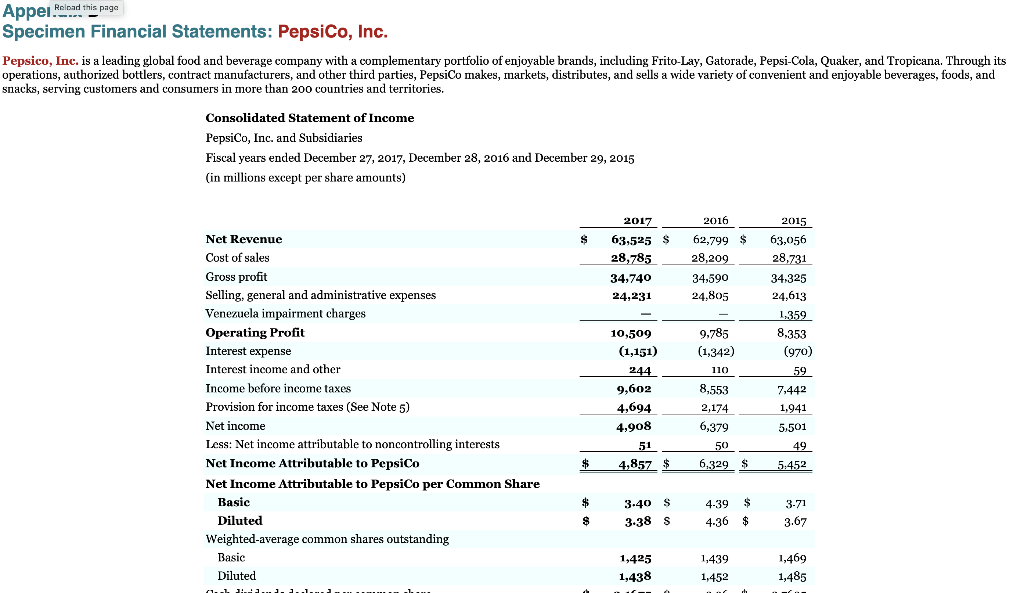
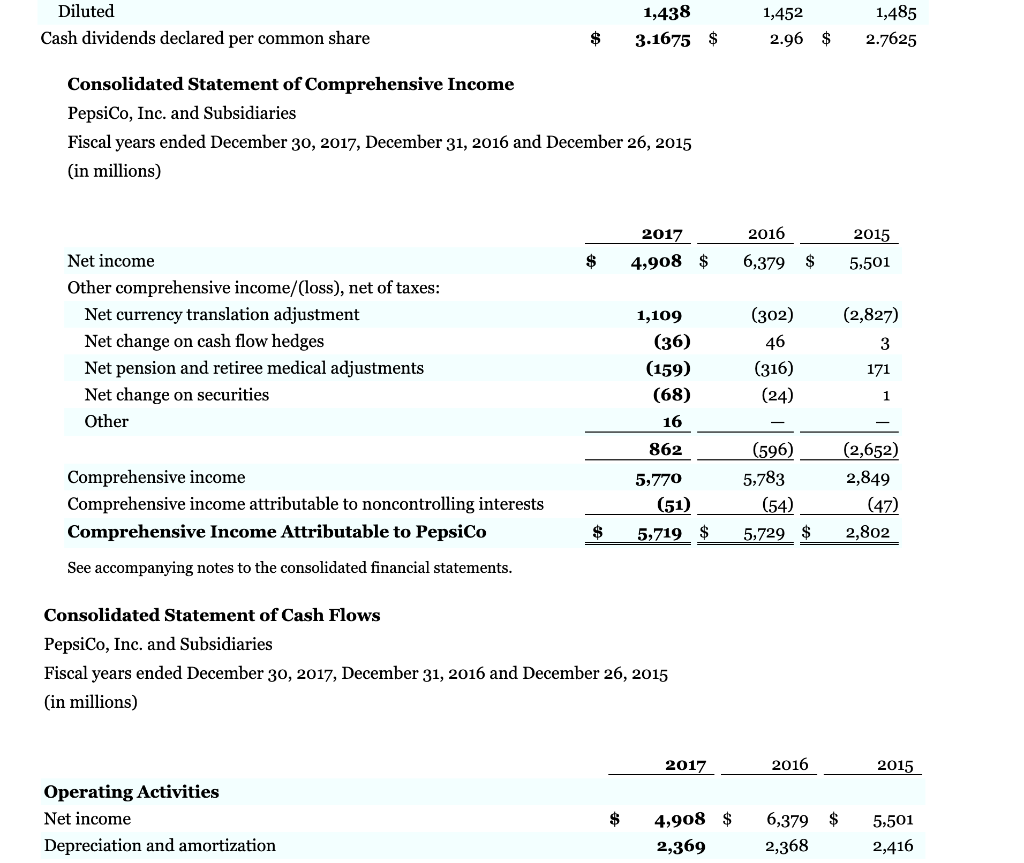
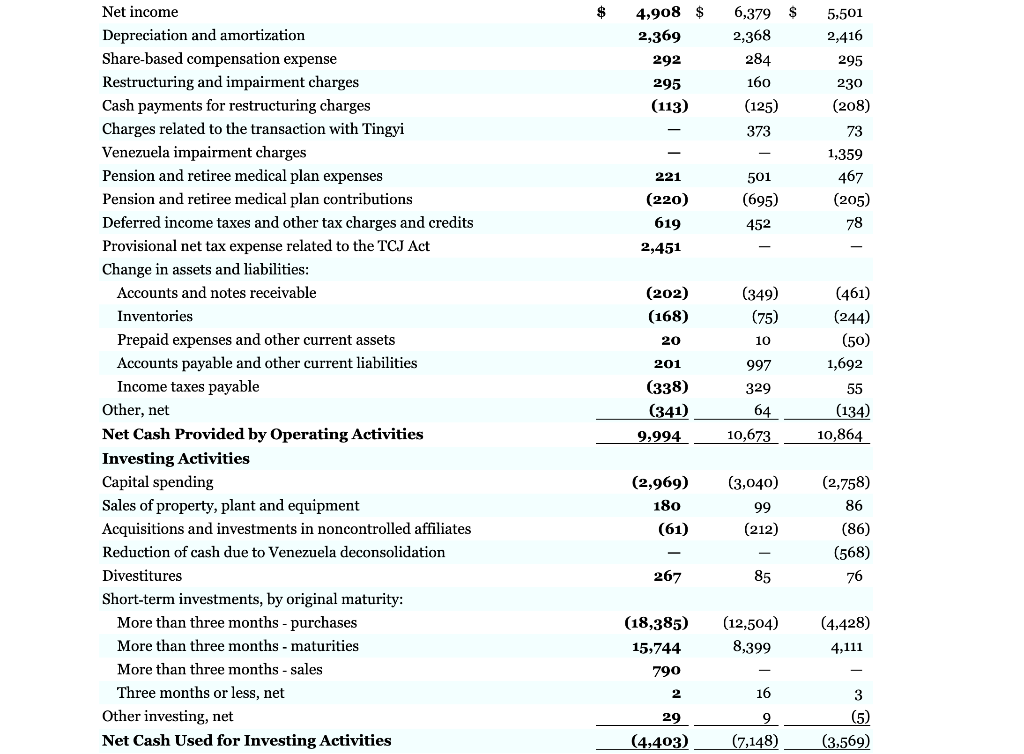
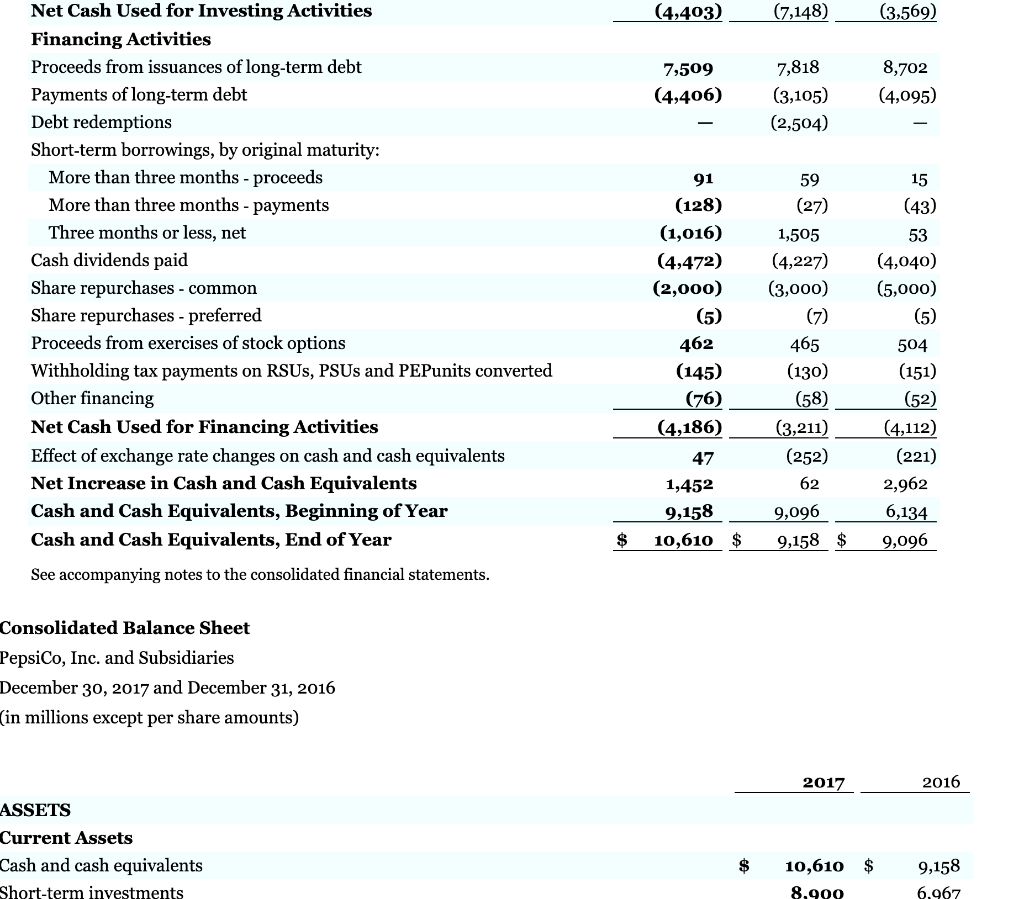
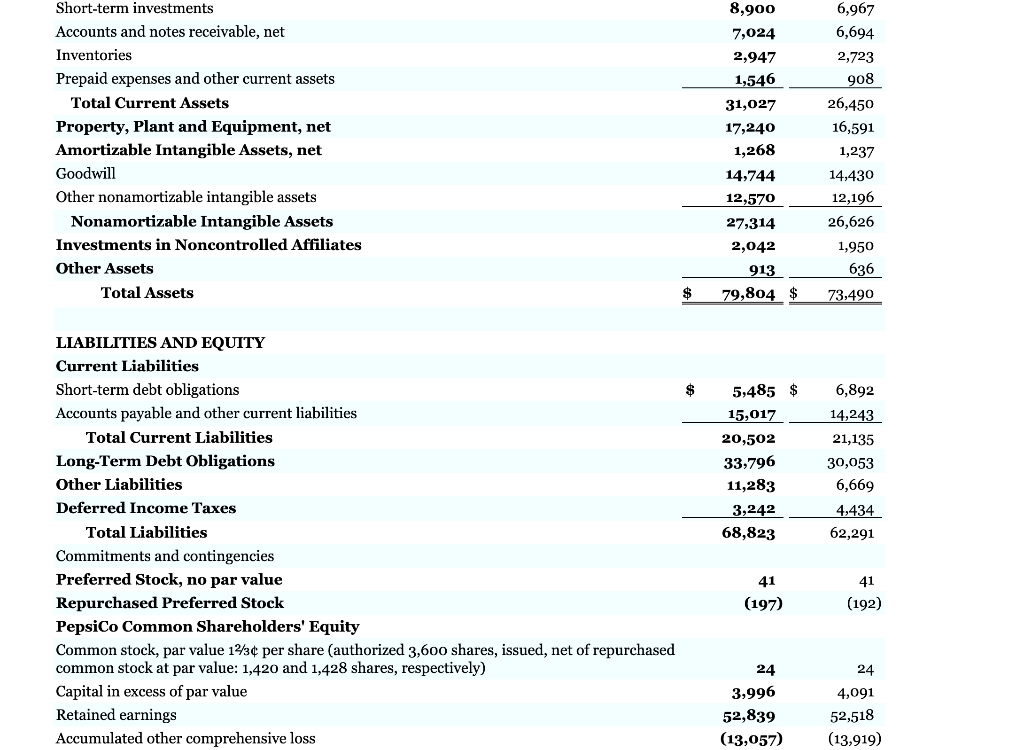
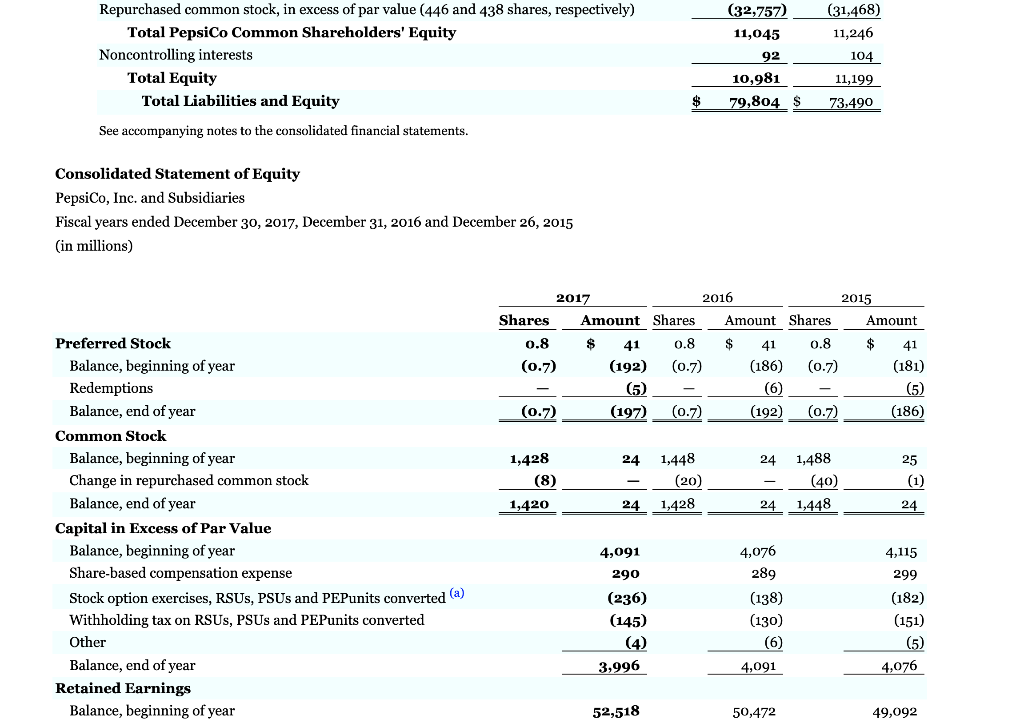
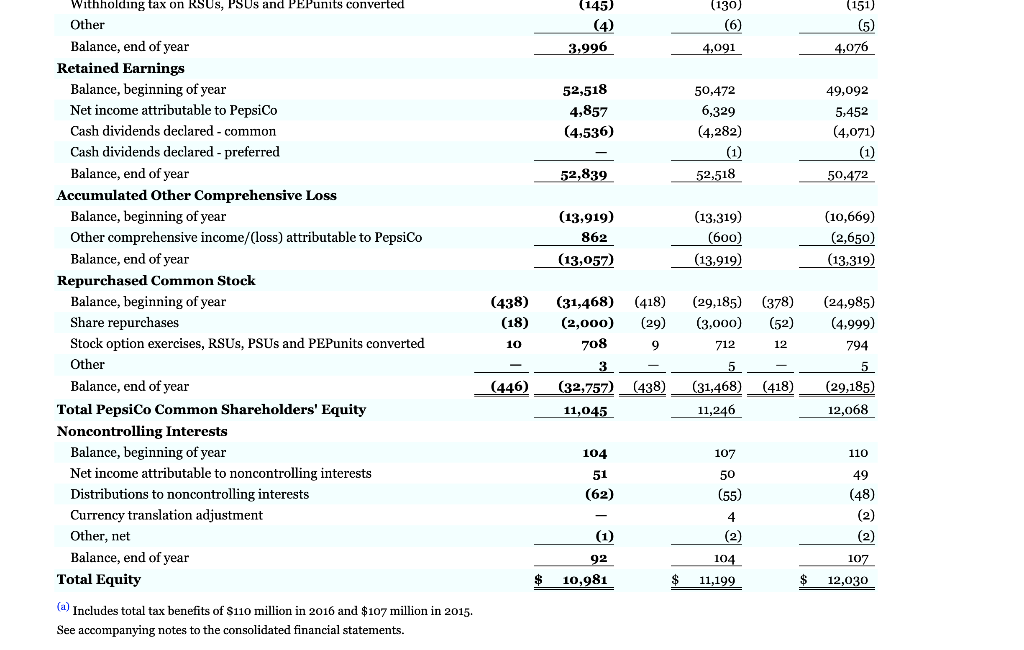
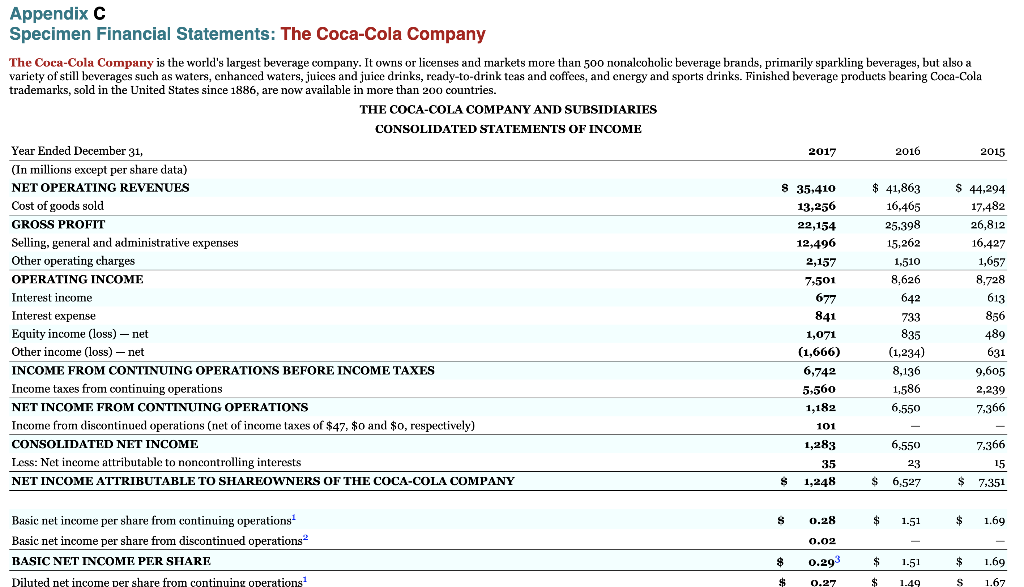
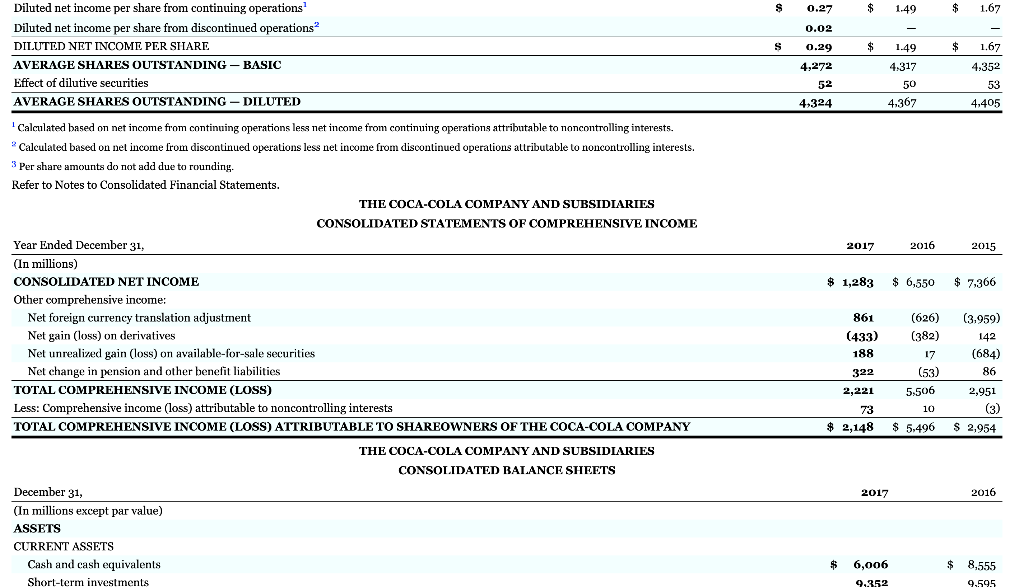
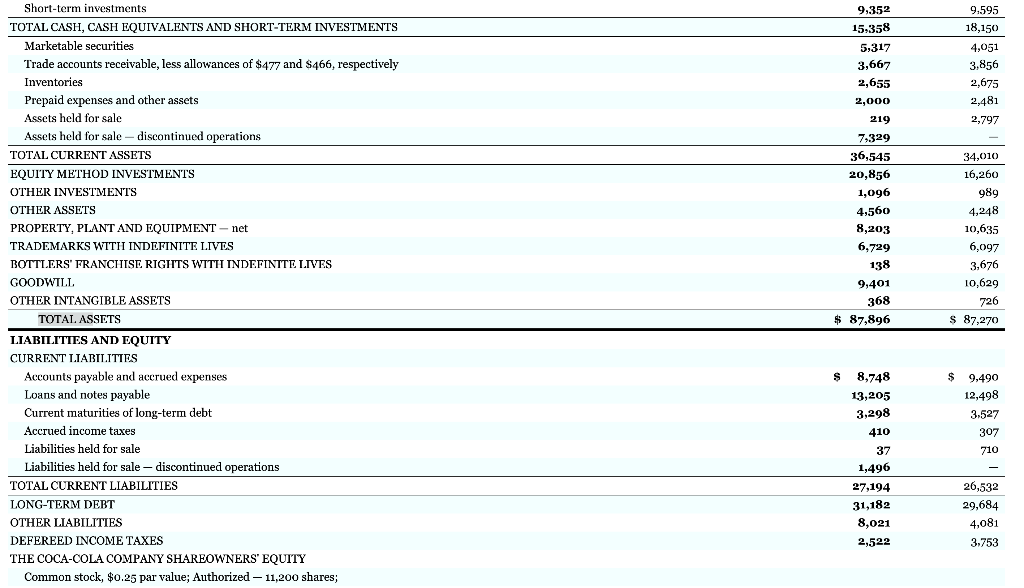
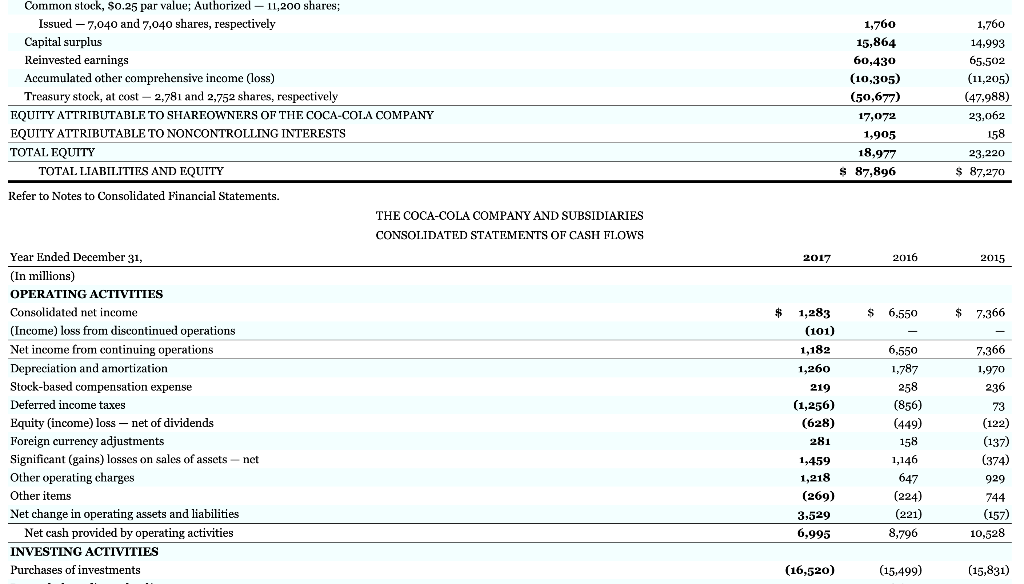
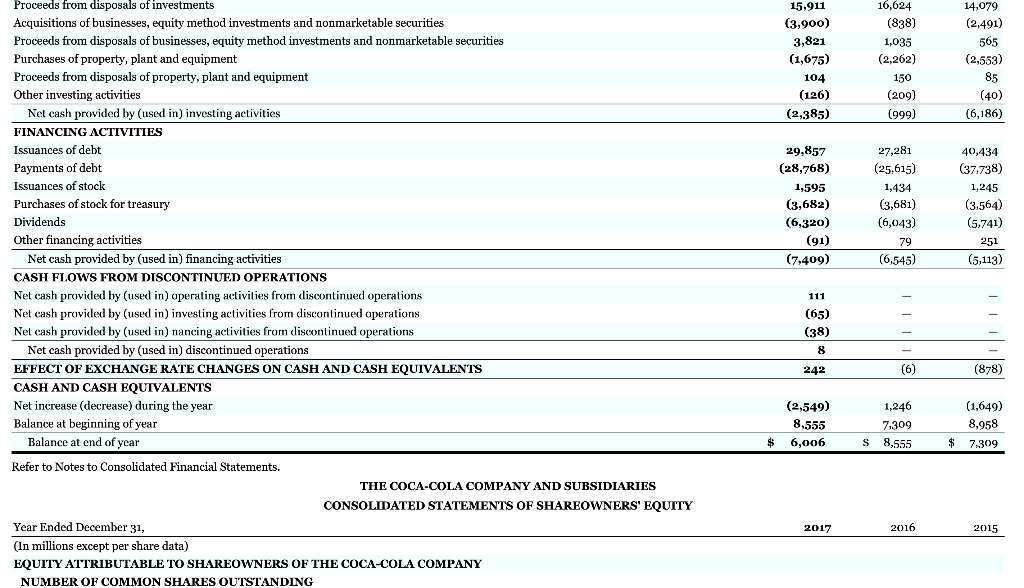
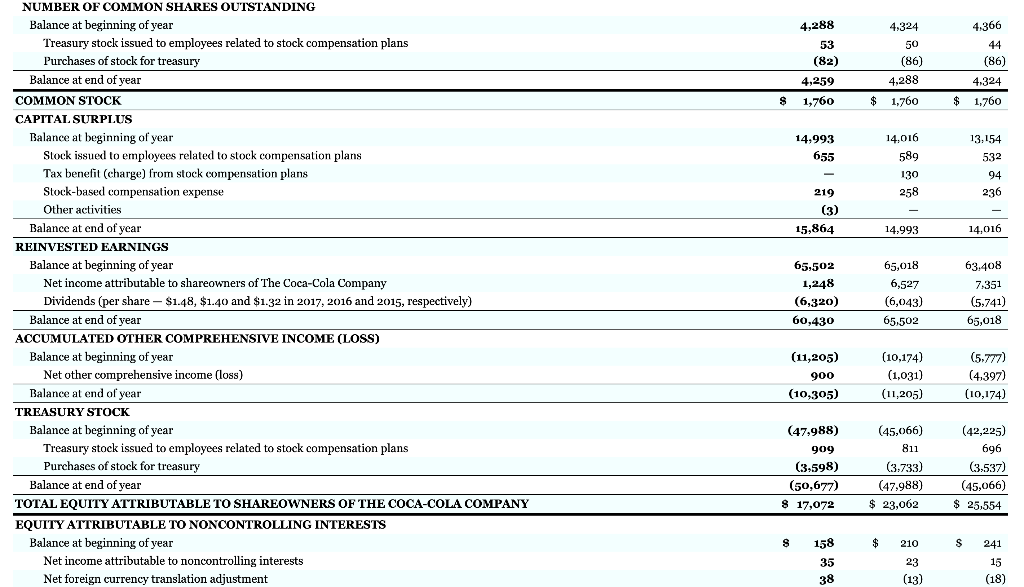
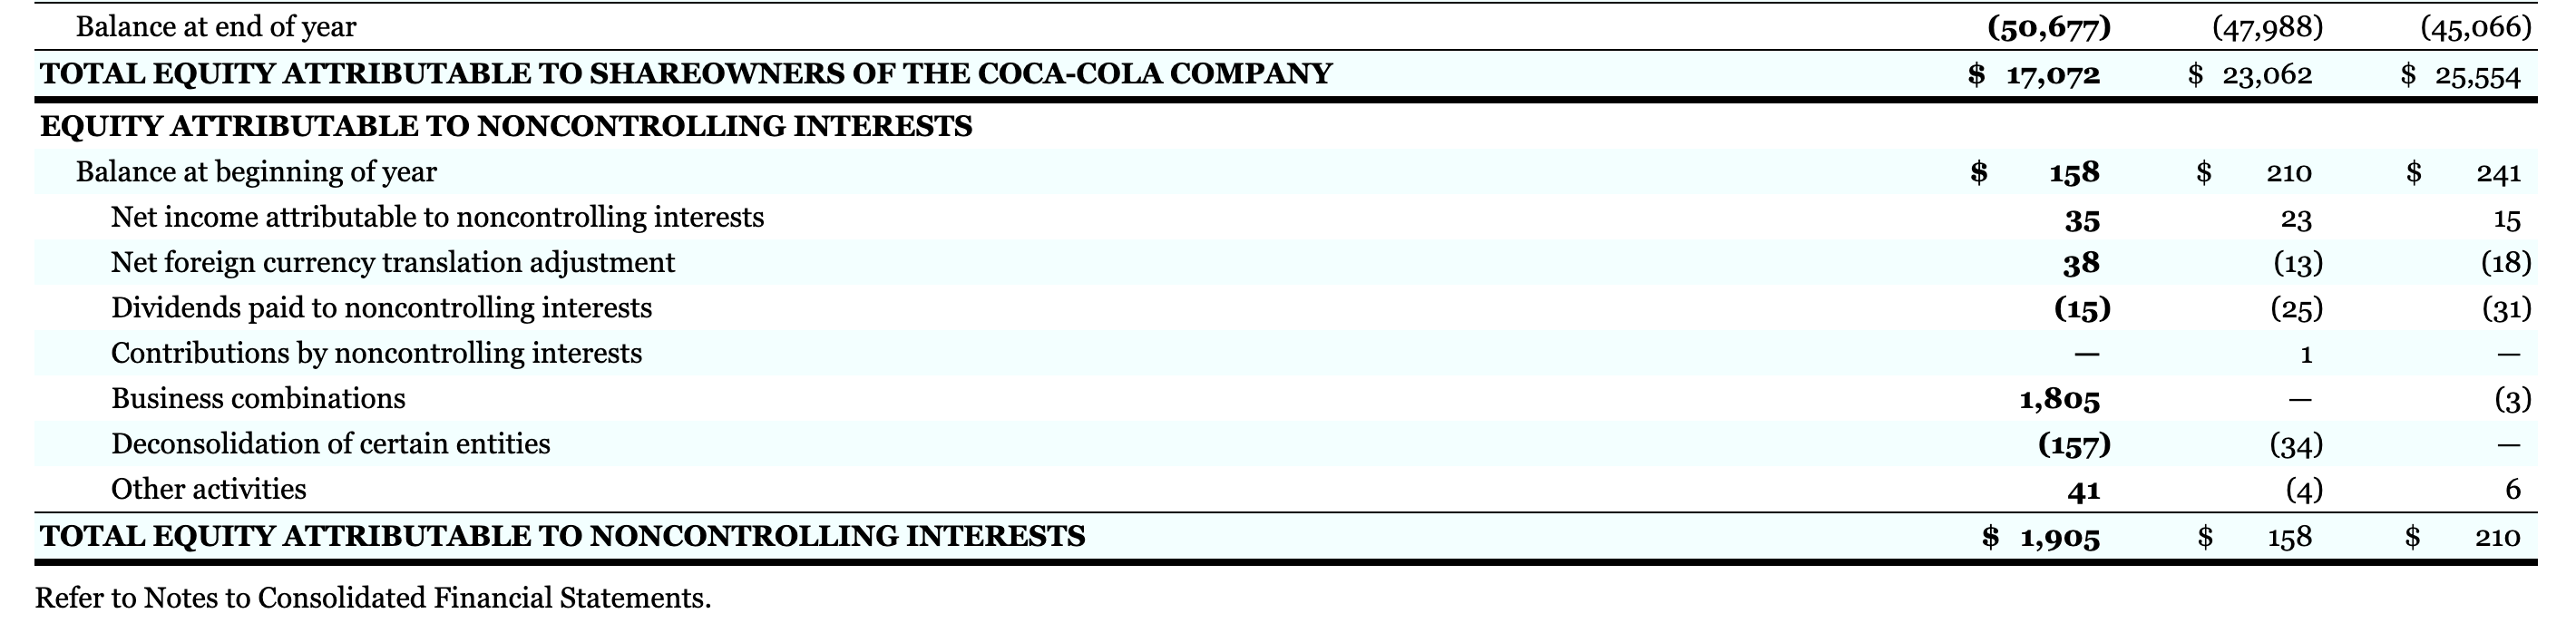
CH 14: Graded Homework Question 11 of 13 0/5 e View Policies Show Attempt History Current Attempt in Progress X Your answer is incorrect. The financial statements of Coca-Cola and PepsiCo are presented in Appendices C and D, respectively. The companies' complete annual reports, including the notes to the financial statements are available online. Click here to view Appendix C Click here to view Appendix D (21) Use the companies' financial information and compute the debt to assets and the times interest earned ratios for these two companies. (Round debt to asset ratio to 1 decimal place, e.g. 12.1%. and times interest earned ratio to 2 decimal places, 15.20.) Coca-Cola Company PepsiCo, Inc. Debt to asset ratio 35.5 % 42.3 % Times interest earned ratio 5.52 times 8.08 times e Textbook and Media Save for Later Attempts: 1 of 3 used Submit Answer Appe, Reilbad this page Reload Specimen Financial Statements: PepsiCo, Inc. Pepsico, Inc. is a leading global food and beverage company with a complementary portfolio of enjoyable brands, including Frito-Lay, Gatorade, Pepsi-Cola, Quaker, and Tropicana. Through its operations, authorized bottlers, contract manufacturers, and other third parties, PepsiCo makes, markets, distributes, and sells a wide variety of convenient and enjoyable beverages, foods, and snacks, serving customers and consumers in more than 200 countries and territories. Consolidated Statement of Income PepsiCo, Inc. and Subsidiaries Fiscal years ended December 27, 2017, December 28, 2016 and December 29, 2015 (in millions except per share amounts) 2016 $ 2017 63,525 $ 28,785 34,740 24,231 62,799 $ 28,209 34,590 24,805 2015 63,056 28,731 34,325 24,613 1,359 8,353 (970) 59 7,442 1,941 5,501 9,785 (1,342) 110 Net Revenue Cost of sales Gross profit Selling, general and administrative expenses Venezuela impairment charges Operating Profit Interest expense Interest income and other Income before income taxes Provision for income taxes (See Note 5) Net income Less: Net income attributable to noncontrolling interests Net Income Attributable to PepsiCo Net Income Attributable to PepsiCo per Common Share Basic Diluted Weighted-average common shares outstanding Basic Diluted 8,553 10,509 (1,151) 244 9,602 4,694 4,908 51 4,857 $ 2,174 6,379 50 6.329 $ 49 5:452 $ $ 3.40 $ 3.38 S 4-39 $ 4.36 $ 3-71 3.67 8 1,425 1,438 1,439 1,452 1,469 1,485 dhe Diluted Cash dividends declared per common share 1,438 3.1675 $ 1,452 2.96 $ 1,485 2.7625 $ Consolidated Statement of Comprehensive Income PepsiCo, Inc. and Subsidiaries Fiscal years ended December 30, 2017, December 31, 2016 and December 26, 2015 (in millions) 2017 2016 2015 5,501 $ 4,908 $ 6,379 $ (2,827) Net income Other comprehensive income/loss), net of taxes: Net currency translation adjustment Net change on cash flow hedges Net pension and retiree medical adjustments Net change on securities Other 3 1,109 (36) (159) (68) (302) 46 (316) (24) 171 1 16 862 Comprehensive income Comprehensive income attributable to noncontrolling interests Comprehensive Income Attributable to PepsiCo 5,770 (51) (596) 5,783 (54) (2,652) 2,849 (47) 2,802 $ 5,719 $ 5,729 $ See accompanying notes to the consolidated financial statements. Consolidated Statement of Cash Flows PepsiCo, Inc. and Subsidiaries Fiscal years ended December 30, 2017, December 31, 2016 and December 26, 2015 (in millions) 2017 2016 2015 Operating Activities Net income Depreciation and amortization $ 4,908 $ 2,369 6,379 $ 2,368 5,501 2,416 $ 4,908 $ 2,369 292 295 (113) 6,379 $ 2,368 284 160 (125) 5,501 2,416 295 230 (208) 73 1,359 467 (205) 78 373 221 (220) 619 2,451 501 (695) 452 (202) (168) (349) (75) 20 10 201 Net income Depreciation and amortization Share-based compensation expense Restructuring and impairment charges Cash payments for restructuring charges Charges related to the transaction with Tingyi Venezuela impairment charges Pension and retiree medical plan expenses Pension and retiree medical plan contributions Deferred income taxes and other tax charges and credits Provisional net tax expense related to the TCJ Act Change in assets and liabilities: Accounts and notes receivable Inventories Prepaid expenses and other current assets Accounts payable and other current liabilities Income taxes payable Other, net Net Cash Provided by Operating Activities Investing Activities Capital spending Sales of property, plant and equipment Acquisitions and investments in noncontrolled affiliates Reduction of cash due to Venezuela deconsolidation Divestitures Short-term investments, by original maturity: More than three months - purchases More than three months - maturities More than three months - sales Three months or less, net Other investing, net Net Cash Used for Investing Activities 997 329 64 (338) (341) (461) (244) (50) 1,692 55 (134) 10,864 9,994 10,673 (3,040) (2,969) 180 (61) 99 (212) (2,758) 86 (86) (568) 76 267 85 (12,504) 8,399 (4,428) 4,111 (18,385) 15,744 790 2 16 9 29 (4,403) 3 (5) (3,569) (7,148) (4,403) (7,148) (3,569) 7,509 (4,406) 7,818 (3,105) (2,504) 8,702 (4,095) Net Cash Used for Investing Activities Financing Activities Proceeds from issuances of long-term debt Payments of long-term debt Debt redemptions Short-term borrowings, by original maturity: More than three months - proceeds More than three months - payments Three months or less, net Cash dividends paid Share repurchases - common Share repurchases - preferred Proceeds from exercises of stock options Withholding tax payments on RSUS, PSUs and PEPunits converted Other financing Net Cash Used for Financing Activities Effect of exchange rate changes on cash and cash equivalents Net Increase in Cash and Cash Equivalents Cash and Cash Equivalents, Beginning of Year Cash and Cash Equivalents, End of Year See accompanying notes to the consolidated financial statements. 91 (128) (1,016) (4,472) (2,000) (5 ) 59 (27) 1,505 (4,227) (3,000) (7) 465 (130) (58) (3,211) (252) 62 462 (145) (76) (4,186) 47 1,452 9,158 10,610 $ 15 (43) 53 (4,040) (5,000) (5) 504 (151) (52) (4,112) (221) 2,962 6,134 9,096 9,096 9,158 $ $ Consolidated Balance Sheet PepsiCo, Inc. and Subsidiaries December 30, 2017 and December 31, 2016 (in millions except per share amounts) 2017 2016 ASSETS Current Assets Cash and cash equivalents Short-term investments $ 10,610 $ 8.999 9,158 6.967 Short-term investments Accounts and notes receivable, net Inventories Prepaid expenses and other current assets Total Current Assets Property, Plant and Equipment, net Amortizable Intangible Assets, net Goodwill Other nonamortizable intangible assets Nonamortizable Intangible Assets Investments in Noncontrolled Affiliates Other Assets Total Assets 8,900 7,024 2,947 1,546 31,027 17,240 1,268 6,967 6,694 2,723 908 26,450 16,591 1,237 14,430 12,196 26,626 1,950 636 14,744 12,570 27,314 2,042 913 79,804 $ $ 73,490 LIABILITIES AND EQUITY Current Liabilities Short-term debt obligations $ Accounts payable and other current liabilities Total Current Liabilities Long-Term Debt Obligations Other Liabilities Deferred Income Taxes Total Liabilities Commitments and contingencies Preferred Stock, no par value Repurchased Preferred Stock PepsiCo Common Shareholders' Equity Common stock, par value 123 per share (authorized 3,600 shares, issued, net of repurchased common stock at par value: 1,420 and 1,428 shares, respectively) Capital in excess of par value Retained earnings Accumulated other comprehensive loss 5,485 $ 15,017 20,502 33,796 11,283 3,242 68,823 6,892 14,243 21,135 30,053 6,669 4,434 62,291 41 (197) 41 (192) 24 3,996 52,839 (13,057) 24 4,091 52,518 (13,919) Repurchased common stock, in excess of par value (446 and 438 shares, respectively) Total PepsiCo Common Shareholders' Equity Noncontrolling interests Total Equity Total Liabilities and Equity (32,757) 11,045 92 10,981 79,804 $ (31,468) 11,246 104 11,199 73,490 $ See accompanying notes to the consolidated financial statements. Consolidated Statement of Equity PepsiCo, Inc. and Subsidiaries Fiscal years ended December 30, 2017, December 31, 2016 and December 26, 2015 (in millions) 2017 2016 2015 Shares Amount Shares Amount Shares Amount 0.8 $ 41 0.8 $ 41 0.8 $ 41 (0.7) (192) (0.7) (186) (0.7) (181) (5) (6) (5) (0.7) (197) (0.7) (192) (0.7) (186) 24 1,428 (8) 24 1,448 (20) 24 1,428 1,488 (40) 1,448 25 (1) 1,420 24 24 Preferred Stock Balance, beginning of year Redemptions Balance, end of year Common Stock Balance, beginning of year Change in repurchased common stock Balance, end of year Capital in Excess of Par Value Balance, beginning of year Share-based compensation expense Stock option exercises, RSUS, PSUs and PEPunits converted (a) Withholding tax on RSUS, PSUs and PEPunits converted Other Balance, end of year Retained Earnings Balance, beginning of year 4,115 4,091 290 (236) (145) (4) 3,996 4,076 289 (138) (130) (6) 4,091 299 (182) (151) (5) 4,076 52,518 50,472 49,092 (145) (4) 3,996 (130) (6) (151) (5) 4,076 4,091 52,518 4,857 (4,536) 50,472 6,329 (4,282) (1) 52,518 49,092 5,452 (4,071) (1) 50,472 52,839 (13,919) 862 (13,057) (13,319) (600) (13,919) (10,669) (2,650) (13.319) Withholding tax on RSUS, PSUs and PEPunits converted Other Balance, end of year Retained Earnings Balance, beginning of year Net income attributable to PepsiCo Cash dividends declared - common Cash dividends declared - preferred Balance, end of year Accumulated Other Comprehensive Loss Balance, beginning of year Other comprehensive income/(loss) attributable to PepsiCo Balance, end of year Repurchased Common Stock Balance, beginning of year Share repurchases Stock option exercises, RSUS, PSUs and PEPunits converted Other Balance, end of year Total PepsiCo Common Shareholders' Equity Noncontrolling Interests Balance, beginning of year Net income attributable to noncontrolling interests Distributions to noncontrolling interests Currency translation adjustment Other, net Balance, end of year Total Equity (a) Includes total tax benefits of S110 million in 2016 and $107 million in 2015. See accompanying notes to the consolidated financial statements. (438) (18) (31,468) (2,000) (418) (29) 9 (29,185) (3,000) 712 (378) (52) 10 708 12 (24,985) (4,999) 794 5 (29,185) 12,068 (446) 3 (32,757) (438) 11,045 (418) (31,468) 11,246 107 110 104 51 (62) 50 (55) 49 (48) (2) . 4 (2) (1) (2) 92 10,981 104 11,199 107 12,030 $ Appendix C Specimen Financial Statements: The Coca-Cola Company The Coca-Cola Company is the world's largest beverage company. It owns or licenses and markets more than 500 nonalcoholic beverage brands, primarily sparkling beverages, but also a variety of still beverages such as waters, enhanced waters, juices and juice drinks, ready-to-drink teas and coffees, and energy and sports drinks. Finished beverage products bearing Coca-Cola trademarks, sold in the United States since 1886, are now available in more than 200 countries. THE COCA-COLA COMPANY AND SUBSIDIARIES CONSOLIDATED STATEMENTS OF INCOME Year Ended December 31, 2017 2016 2015 (In millions except per share data) NET OPERATING REVENUES S 35,410 $ 41,863 $ 44,294 Cost of goods sold 13,256 16,465 17.482 GROSS PROFIT 22,154 25.398 26,812 Selling, general and administrative expenses 12,496 15,262 16,427 Other operating charges 2,157 1,510 1,657 OPERATING INCOME 7,501 8,626 8,728 Interest income 677 642 613 Interest expense 841 733 856 Equity income (loss) - net 1,071 835 489 Other income (loss) net (1,666) (1,234) 631 INCOME FROM CONTINUING OPERATIONS BEFORE INCOME TAXES 6,742 8,136 9,605 Income taxes from continuing operations 5,560 1,586 2,239 NET INCOME FROM CONTINUING OPERATIONS 1,182 6.550 7.366 Income from discontinued operations (net of income taxes of $47. $0 and $0, respectively) CONSOLIDATED NET INCOME 1,283 6,550 7,366 Less: Net income attributable to noncontrolling interests 35 23 15 NET INCOME ATTRIBUTABLE TO SHAREOWNERS OF THE COCA-COLA COMPANY 1,248 $ 6.527 $ 7,351 101 $ S 0.28 $ 1.51 $ 1.69 0.02 Basic net income per share from continuing operations Basic net income per share from discontinued operations BASIC NET INCOME PER SHARE Diluted net income per share from continuing operations $ 0.293 $ 1.51 $ 1.69 $ 0.27 $ 1.49 s 1.67 S 0.27 $ $ 1.49 $ 1.67 0.02 S 0.29 $ 1.49 $ 1.67 Diluted net income per share from continuing operations Diluted net income per share from discontinued operations DILUTED NET INCOME PER SHARE AVERAGE SHARES OUTSTANDING BASIC Effect of dilutive securities AVERAGE SHARES OUTSTANDING - DILUTED 4,272 52 4:317 50 4,367 4,352 53 4.324 4,405 2017 2016 2015 $ 1,283 $ 6,550 $ 7.366 Calculated based on net income from continuing operations less net income from continuing operations attributable to noncontrolling interests. 2 Calculated based on net income from discontinued operations less net income from discontinued operations allributable to noncontrolling interests. 3 Per share amounts do not add due to rounding. Refer to Notes to Consolidated Financial Statements. THE COCA-COLA COMPANY AND SUBSIDIARIES CONSOLIDATED STATEMENTS OF COMPREHENSIVE INCOME Year Ended December 31, (In millions) CONSOLIDATED NET INCOME Other comprehensive income: Net foreign currency translation adjustment Net gain (loss) on derivatives Net unrealized gain (loss) on available-for-sale securities Net change in pension and other benefit liabilities TOTAL COMPREHENSIVE INCOME (LOSS) Less: Comprehensive income (loss) attributable to noncontrolling interests TOTAL COMPREHENSIVE INCOME (LOSS) ATTRIBUTABLE TO SHAREOWNERS OF THE COCA-COLA COMPANY THE COCA-COLA COMPANY AND SUBSIDIARIES CONSOLIDATED BALANCE SHEETS December 31, (In millions except par value) ASSETS CURRENT ASSETS Cash and cash equivalents Short-term investments 861 (433) 188 322 (626) (382) 17 (53) 5.506 10 $ 5,496 (3.959) 142 (684) 86 2,221 73 $ 2,148 2,951 (3) $ 2,954 2017 2016 $ 6,006 $ 8.555 9,595 9,352 9.595 18,150 4,051 3,856 2,675 2,481 2,797 Short-term investments TOTAL CASH, CASH EQUIVALENTS AND SHORT-TERM INVESTMENTS Marketable securities Trade accounts receivable, less allowances of $477 and $466, respectively Inventories Prepaid expenses and other assets Assets held for sale Assets held for sale - discontinued operations TOTAL CURRENT ASSETS EQUITY METHOD INVESTMENTS OTHER INVESTMENTS OTHER ASSETS PROPERTY, PLANT AND EQUIPMENT - net TRADEMARKS WITH INDEFINITE LIVES BOTTLERS' FRANCHISE RIGHTS WITH INDEFINITE LIVES GOODWILL OTHER INTANGIBLE ASSETS TOTAL ASSETS LIABILITIES AND EQUITY CURRENT LIABILITIES Accounts payable and accrued expenses Loans and notes payable Current maturities of long-term debt Accrued income taxes Liabilities held for sale Liabilities held for sale - discontinued operations TOTAL CURRENT LIABILITIES LONG-TERM DEBT OTHER LIABILITIES DEFEREED INCOME TAXES THE COCA-COLA COMPANY SHAREOWNERS' EQUITY Common stock, $0.25 par value; Authorized 11,200 shares; 9,352 15,358 5,317 3,667 2,655 2,000 219 7,329 36,545 20,856 1,096 4,560 8,203 6,729 138 9,401 368 $ 87,896 34,010 16,260 989 4,248 10,635 6,097 3,676 10,629 726 $ 87,270 $ 8,748 13,205 3,298 410 37 $ 9,490 12,498 3.527 307 710 1,496 37.194 31,182 8,021 26,532 29,684 4,081 3,753 2,522 Common stock, $0.25 par value; Authorized 11,200 shares; Issued 7,040 and 7,040 shares, respectively Capital surplus Reinvested earnings Accumulated other comprehensive income (loss) Treasury stock, at cost - 2,781 and 2,752 shares, respectively EQUITY ATTRIBUTABLE TO SHAREOWNERS OF THE COCA-COLA COMPANY EQUITY ATTRIBUTABLE TO NONCONTROLLING INTERESTS TOTAL EQUITY TOTAL LIABILITIES AND EQUITY 1,760 15,864 60,430 (10,305) (50,677) 17,072 1,905 18,977 $ 87,896 1,760 14,993 65,502 (11,205) (47.988) 23,062 158 23,220 $ 87,270 Refer to Notes to Consolidated Financial Statements. THE COCA-COLA COMPANY AND SUBSIDIARIES CONSOLIDATED STATEMENTS OF CASH FLOWS 2017 2016 2015 $ $ 6,550 $ 7,366 7.366 1,970 236 Year Ended December 31, (In millions) OPERATING ACTIVITIES Consolidated net income (Income) loss from discontinued operations Net income from continuing operations Depreciation and amortization Stock-based compensation expense Deferred income taxes Equity (income) loss net of dividends Foreign currency adjustments Significant (gains) losses on sales of assets - net Other operating charges Other items Net change in operating assets and liabilities Net cash provided by operating activities INVESTING ACTIVITIES Purchases of investments 1,283 (101) 1,182 1,260 219 (1,256) ( (628) 281 1,459 1,218 (269) 3,529 6,995 6,550 1,787 258 (856) (449) 158 1,146 647 (224) (221) 8,796 73 (122) (137) (374) 929 744 (157) 10,528 (16,520) (15,499) (15,831) 16,624 (838) 15,911 (3,900) 3,821 (1,675) 104 (126) (2,385) 1,035 (2,262) 14,079 (2,491) 565 (2,553) 85 (40) (6,186) 150 (209) (999) 29,857 (28,768) 1,595 (3,682) (6,320) (91) (7,409) 27,281 (25.615) 1,434 (3,681) (6,043) 79 (6,545) 40,434 (37.738) 1,245 (3.564) (5,741) 251 (5,113) Proceeds from disposals of investments Acquisitions of businesses, equity method investments and nonmarketable securities Proceeds from disposals of businesses, equity method investments and nonmarketable securities Purchases of property, plant and equipment Proceeds from disposals of property, plant and equipment Other investing activities Net cash provided by (used in) investing activities FINANCING ACTIVITIES Issuances of debt Payments of debt Issuances of stock Purchases of stock for treasury Dividends Other financing activities Net cash provided by (used in) financing activities CASH FLOWS FROM DISCONTINUED OPERATIONS Net cash provided by (used in) operating activities from discontinued operations Net cash provided by (used in) investing activities from discontinued operations Net cash provided by (used in) nancing activities from discontinued operations Net cash provided by (used in) discontinued operations EFFECT OF EXCHANGE RATE CHANGES ON CASH AND CASH EQUIVALENTS CASH AND CASH EQUIVALENTS Net increase (decrease) during the year Balance at beginning of year Balance at end of year Refer to Notes to Consolidated Financial Statements. THE COCA-COLA COMPANY AND SUBSIDIARIES CONSOLIDATED STATEMENTS OF SHAREOWNERS' EQUITY Year Ended December 31, (In millions except per share data) EQUITY ATTRIBUTABLE TO SHAREOWNERS OF THE COCA-COLA COMPANY NUMBER OF COMMON SHARES OUTSTANDING 111 (65) (38) 8 242 (6) (878) (2,549) 8,555 6,006 1,246 7.309 (1,649) 8,958 $ 7:309 $ S 8,555 2017 2016 2015 4,288 4,324 50 (86) 4,288 4.366 44 (86) 53 (82) 4,259 1,760 4.324 $ 1,760 $ $ 1,760 14,993 655 14,016 589 130 13.154 532 94 236 258 219 (3) 15,864 14,993 14,016 NUMBER OF COMMON SHARES OUTSTANDING Balance at beginning of year Treasury stock issued to employees related to stock compensation plans Purchases of stock for treasury Balance at end of year COMMON STOCK CAPITAL SURPLUS Balance at beginning of year Stock issued to employees related to stock compensation plans Tax benefit (charge) from stock compensation plans Stock-based compensation expense Other activities Balance at end of year REINVESTED EARNINGS Balance at beginning of year Net income attributable to shareowners of The Coca-Cola Company Dividends (per share - $1.48, $1.40 and $1.32 in 2017, 2016 and 2015, respectively) Balance at end of year ACCUMULATED OTHER COMPREHENSIVE INCOME (LOSS) Balance at beginning of year Net other comprehensive income (loss) Balance at end of year TREASURY STOCK Balance at beginning of year Treasury stock issued to employees related to stock compensation plans Purchases of stock for treasury Balance at end of year TOTAL EQUITY ATTRIBUTABLE TO SHAREOWNERS OF THE COCA-COLA COMPANY EQUITY ATTRIBUTABLE TO NONCONTROLLING INTERESTS Balance at beginning of year Net income attributable to noncontrolling interests Net foreign currency translation adjustment 65,502 1,248 (6,320) 60,430 65,018 6,527 (6,043) 65,502 63,408 7:351 (5,741) 65,018 (11,205) 900 (10,305) (10,174) (1,031) (11,205) (5.777) (4.397) (10,174) (47,988) 909 (3,598) (50,677) 8 17,072 (45,066) 811 (3,733) (47,988) $ 23,062 (42,225) 696 (3,537) (45,066) $ 25,554 8 158 $ 210 S 35 23 (13) 241 15 (18) 38 (50,677) (47,988) $ 23,062 (45,066) $ 25,554 $ 17,072 158 210 $ 241 35 38 Balance at end of year TOTAL EQUITY ATTRIBUTABLE TO SHAREOWNERS OF THE COCA-COLA COMPANY EQUITY ATTRIBUTABLE TO NONCONTROLLING INTERESTS Balance at beginning of year Net income attributable to noncontrolling interests Net foreign currency translation adjustment Dividends paid to noncontrolling interests Contributions by noncontrolling interests Business combinations Deconsolidation of certain entities Other activities TOTAL EQUITY ATTRIBUTABLE TO NONCONTROLLING INTERESTS 23 (13) (25) 15 (18) (31) (15) 1 1,805 (3) | | 0 (157) (34) (4) 41 6 $ 1,905 $ 158 $ 210 Refer to Notes to Consolidated Financial Statements
Step by Step Solution
There are 3 Steps involved in it

Get step-by-step solutions from verified subject matter experts