

Question: Please help! I'll make sure to rate! Construct the appropriate control chart for the sample observations listed below Observation 1 2 4 5 6 7
Please help! I'll make sure to rate!
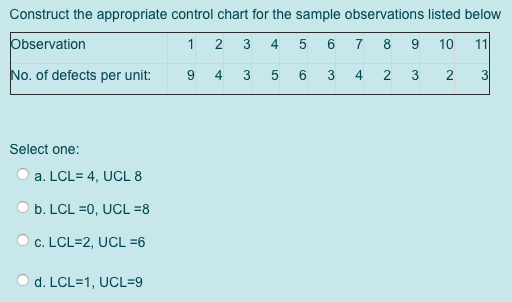
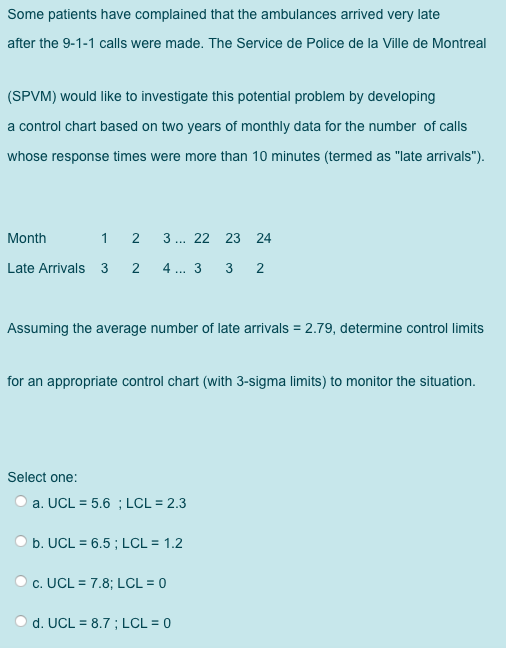
Construct the appropriate control chart for the sample observations listed below Observation 1 2 4 5 6 7 8 9 10 11 No. of defects per unit: 9 4 5 6 3 4 2 3 2. 3 Select one: a. LCL= 4, UCL 8 b. LCL =0, UCL =8 c. LCL=2, UCL =6 d. LCL=1, UCL=9 Some patients have complained that the ambulances arrived very late after the 9-1-1 calls were made. The Service de Police de la Ville de Montreal (SPVM) would like to investigate this potential problem by developing a control chart based on two years of monthly data for the number of calls whose response times were more than 10 minutes (termed as "late arrivals"). Month 1 2. 22 23 24 Late Arrivals 3 2 4... 3 3 2 Assuming the average number of late arrivals = 2.79, determine control limits for an appropriate control chart (with 3-sigma limits) to monitor the situation. Select one: a. UCL = 5.6 ; LCL = 2.3 b. UCL = 6.5; LCL = 1.2 c. UCL = 7.8; LCL = 0 d. UCL = 8.7 ; LCL = 0Step by Step Solution
There are 3 Steps involved in it
1 Expert Approved Answer
Step: 1 Unlock

Question Has Been Solved by an Expert!
Get step-by-step solutions from verified subject matter experts
Step: 2 Unlock
Step: 3 Unlock