

Question: Please help, I'll upvote your work :) Example 3: The following graph shows the population size in a small city in the years 2001 2011
Please help, I'll upvote your work :)
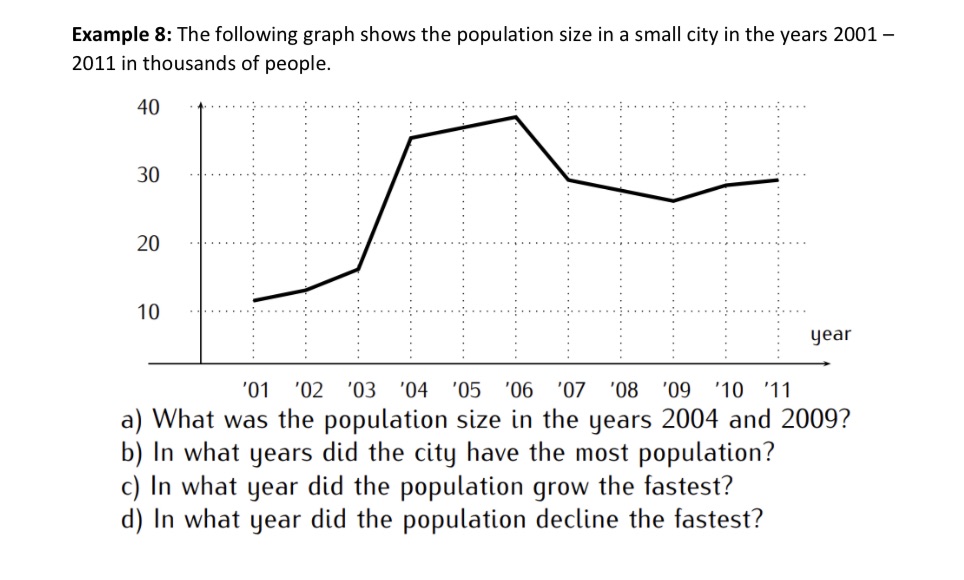
Example 3: The following graph shows the population size in a small city in the years 2001 2011 in thousands of people. 40 30 '01 '02 '03 '04 '05 '06 '07 '08 '09 '10 '11 a) What was the population size in the gears 2004 and 2009? b) In what gears did the citg have the most population? c) In what gear did the population grow the fastest? d) In what gear did the population decline the fastest
Step by Step Solution
There are 3 Steps involved in it
1 Expert Approved Answer
Step: 1 Unlock

Question Has Been Solved by an Expert!
Get step-by-step solutions from verified subject matter experts
Step: 2 Unlock
Step: 3 Unlock