

Question: Please help I'm not sure what to do Physics: Displacement & Velocity WCLN.ca 3. Examine the graph below. Using a pencil sketch in a PREDICTED
Please help I'm not sure what to do
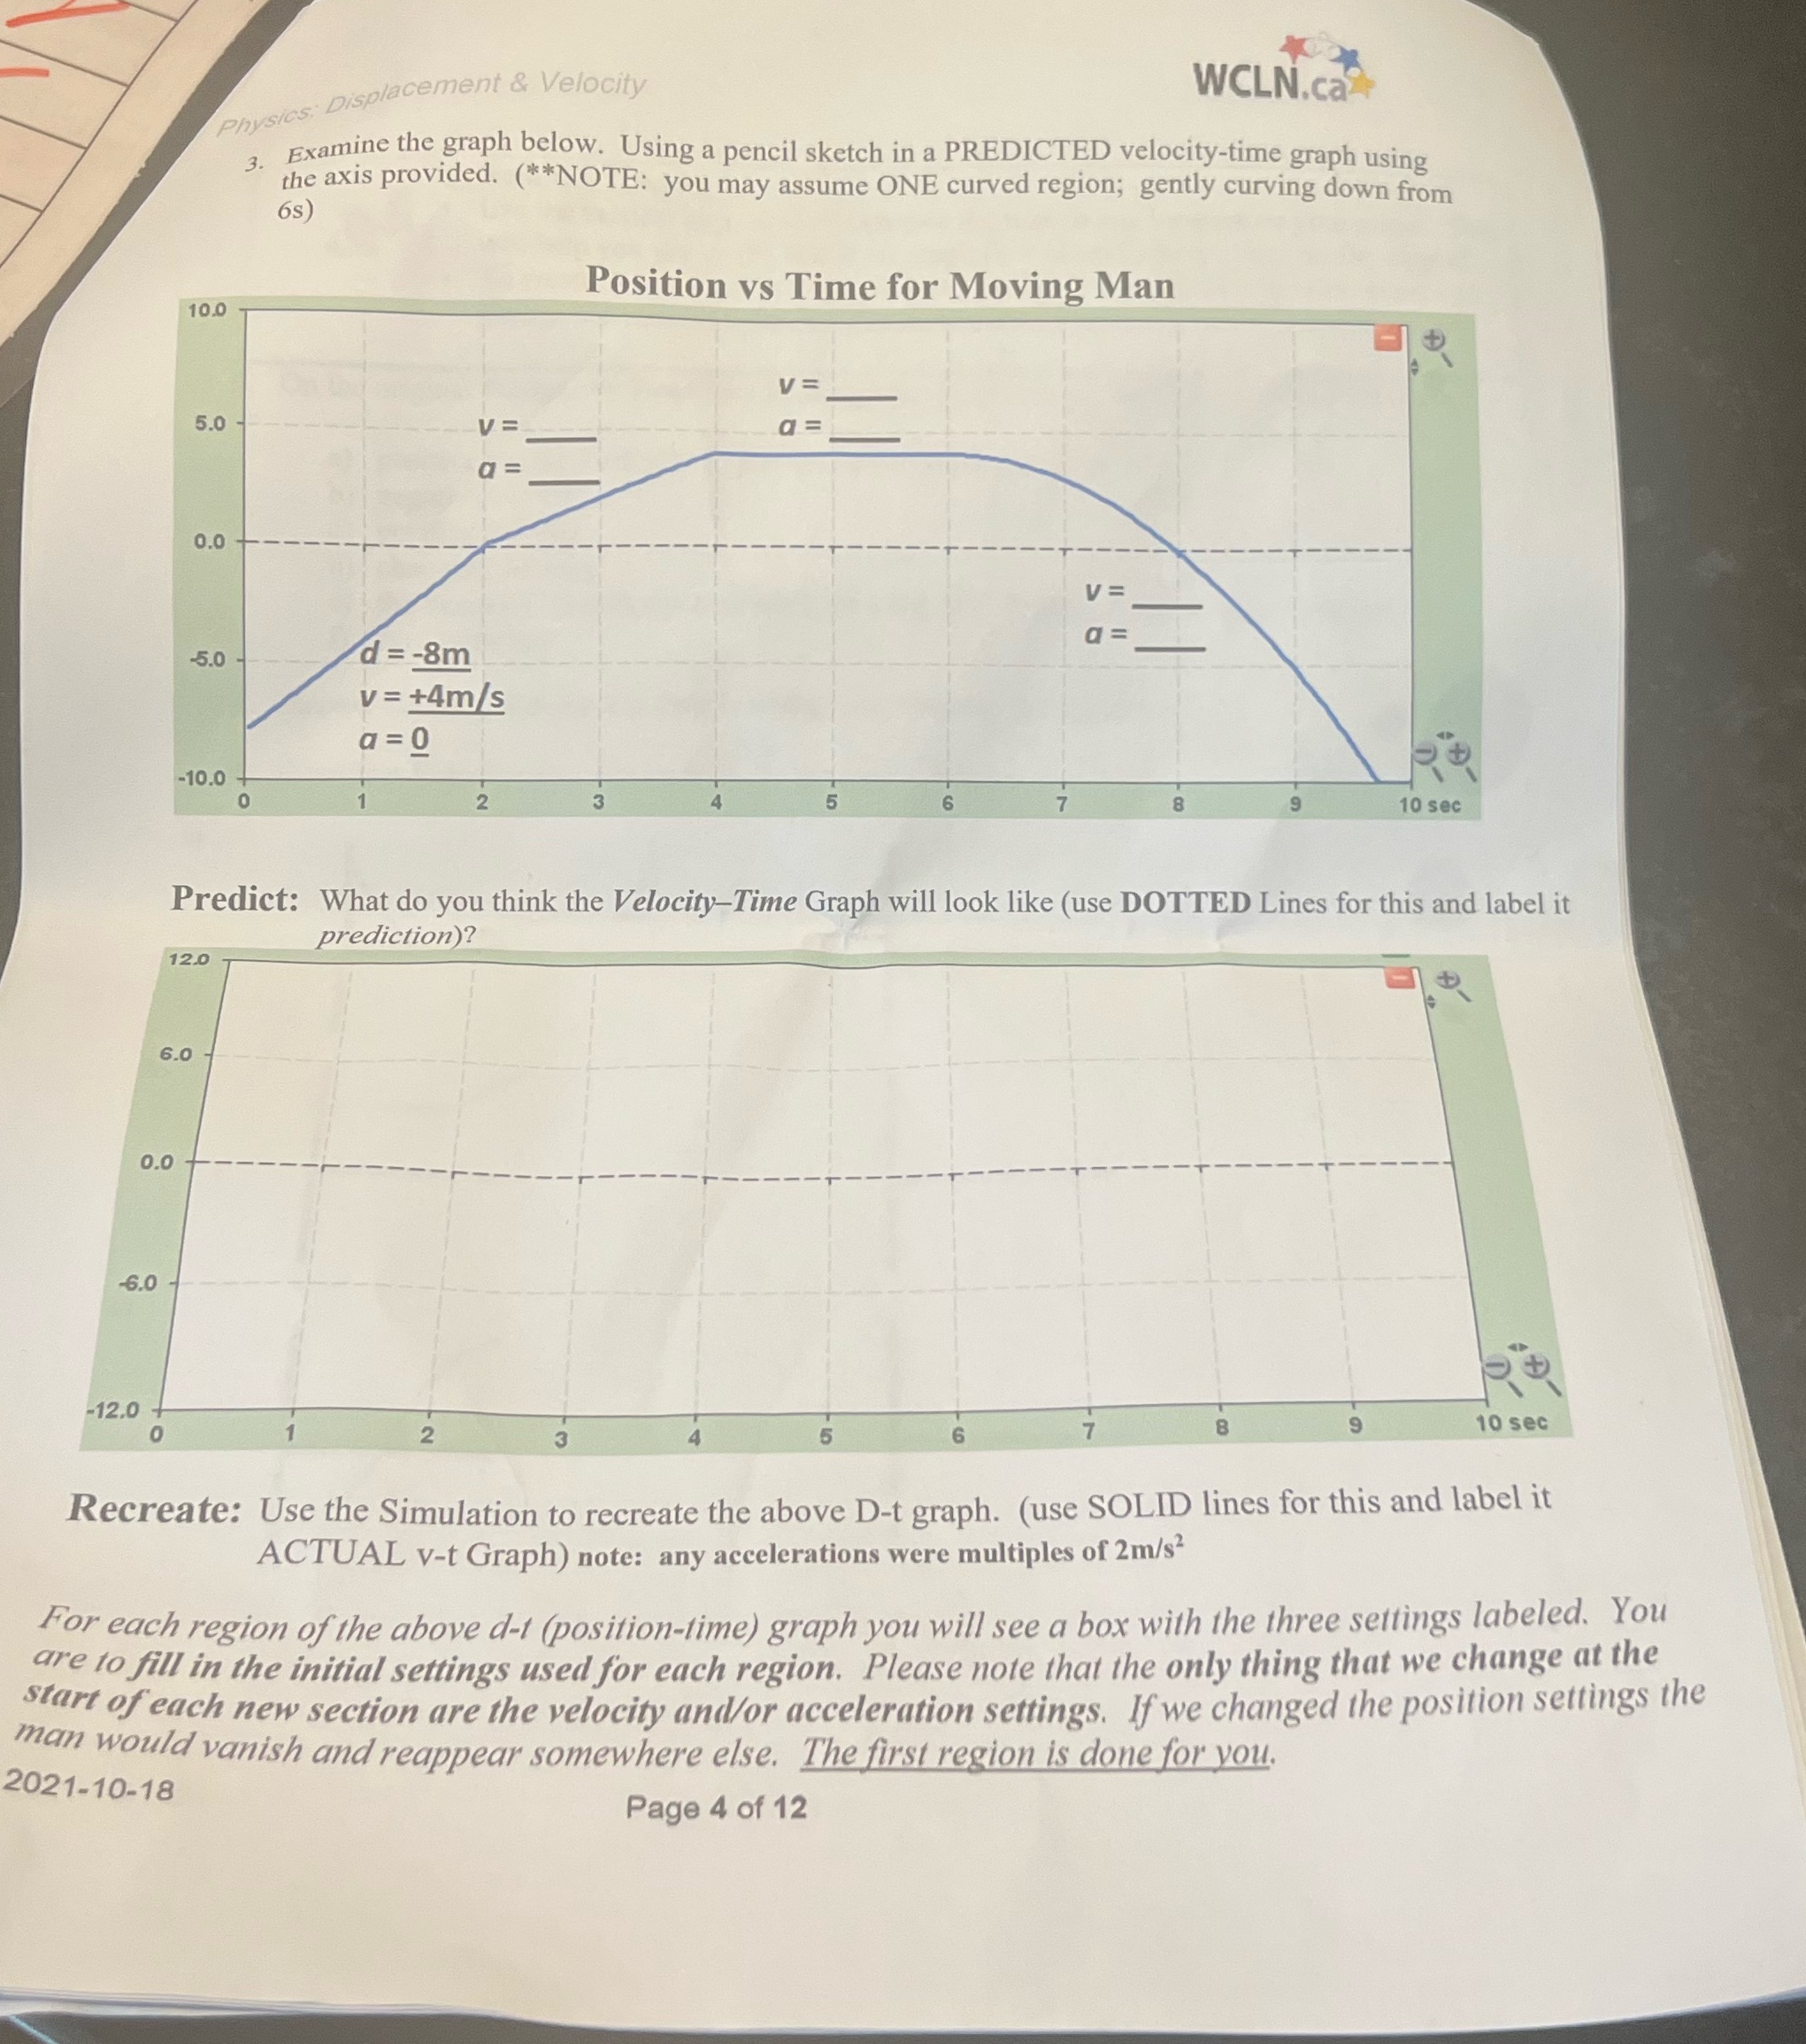
Physics: Displacement & Velocity WCLN.ca 3. Examine the graph below. Using a pencil sketch in a PREDICTED velocity-time graph using the axis provided. (**NOTE: you may assume ONE curved region; gently curving down from 6s) Position vs Time for Moving Man 10.0 V = 5.0 V= a = a = 0.0 V = a = -5.0 d = -8m V = +4m/s a = 0 -10.0 2 10 sec Predict: What do you think the Velocity-Time Graph will look like (use DOTTED Lines for this and label it prediction)? 12.0 6.0 0.0 -6.0 -12.0 10 sec Recreate: Use the Simulation to recreate the above D-t graph. (use SOLID lines for this and label it ACTUAL v-t Graph) note: any accelerations were multiples of 2m/s? For each region of the above d-t (position-time) graph you will see a box with the three settings labeled. You are to fill in the initial settings used for each region. Please note that the only thing that we change at the start of each new section are the velocity and/or acceleration settings. If we changed the position settings the man would vanish and reappear somewhere else. The first region is done for you. 2021-10-18 Page 4 of 12
Step by Step Solution
There are 3 Steps involved in it

Get step-by-step solutions from verified subject matter experts