

Question: Please help in below R programming question: Consider the last five years of the Gas data from aus_production using below code; Please use the library(forecast)
Please help in below R programming question:
Consider the last five years of the Gas data from aus_production using below code; Please use the library(forecast) for the dataset.
gas % select(Gas):
1. Plot the time series, name y-axis lab - "Petajoules". [This is a name for energy unit]. Please help in identify seasonal fluctuations and/or a trend-cycle
2. Use classical_decomposition with type=multiplicative to calculate the trend-cycle and seasonal indices. Name new series decomp. Plot decomp. Please help in results support the graphical interpretation from 1 st question above.
3.Above we created new series decomp - this series has now additional columns. Please help in Finding the column that measures seasonally adjusted values (we can use head(decomp) or view(decomp) or look at environment panel (top right)). Compute and plot the seasonally adjusted data.
- Important Step: convert the decomp to tsibble (as_tsibble(decomp)) - do not need any other parameters. If we do not use this step, the plot will display decomposition panels instead of just seasonally adjusted plot. Please Add title and y-axis label - "Petajoules".
Attached the image of the question which might help if miss to type anything above.
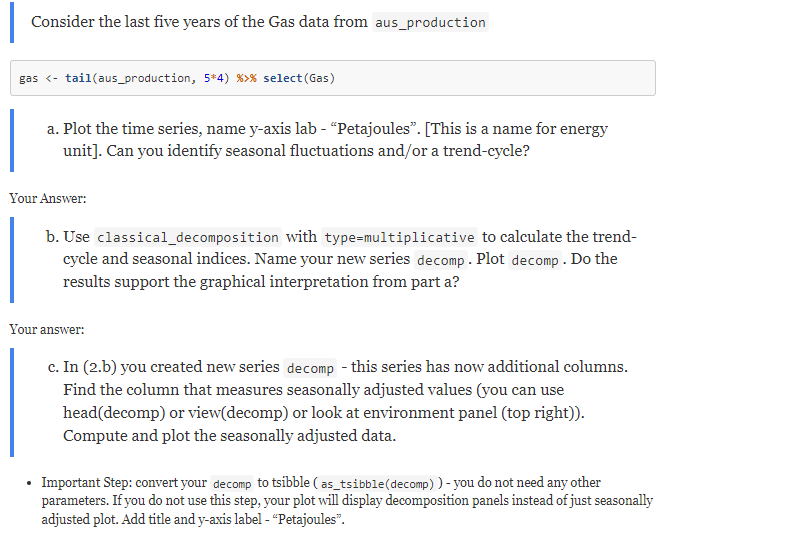
Consider the last five years of the Gas data from aus_production gas * select(Gas) a. Plot the time series, name y-axis lab - "Petajoules". [This is a name for energy unit]. Can you identify seasonal fluctuations and/or a trend-cycle? Your Answer: b. Use classical_decomposition with type=multiplicative to calculate the trend- cycle and seasonal indices. Name your new series decomp . Plot decomp . Do the results support the graphical interpretation from part a? Your answer: c. In (2.b) you created new series decomp - this series has now additional columns. Find the column that measures seasonally adjusted values (you can use head(decomp) or view(decomp) or look at environment panel (top right)). Compute and plot the seasonally adjusted data. . Important Step: convert your decomp to tsibble ( as_tsibble(decomp) ) - you do not need any other parameters. If you do not use this step, your plot will display decomposition panels instead of just seasonally adjusted plot. Add title and y-axis label - "Petajoules"
Step by Step Solution
There are 3 Steps involved in it

Get step-by-step solutions from verified subject matter experts