

Question: Please help in making an excel line chart for the following data. There are 15 customers for the months of Jan, Feb and march. (see
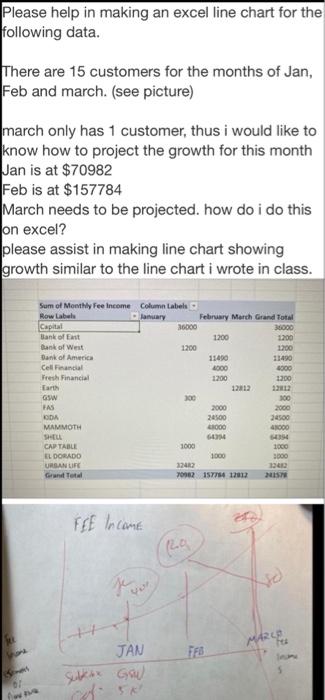
Please help in making an excel line chart for the following data. There are 15 customers for the months of Jan, Feb and march. (see picture) march only has 1 customer, thus i would like to know how to project the growth for this month Jan is at $70982 Feb is at $157784 March needs to be projected, how do i do this on excel? please assist in making line chart showing growth similar to the line chart i wrote in class. 3000 Sum of Monthly Fee Income Column Label How Labels January February March Grand Total Capital 36000 Bank of East 1200 1200 Bank of West 1200 1200 Dank of America 11450 11490 Cell Financial 6300 Fresh Financial 1200 2300 Eart GW 100 FAS 2000 2000 ODA 24500 34500 MAMMOTH 1000 4000 1000 1000 3000 CAPTABLE EL DORADO URBAN LIFE Grand Total 3242 70902 15774 12012 STE FEE Income 120 je So MAR JAN sulks Gow 5*
Step by Step Solution
There are 3 Steps involved in it

Get step-by-step solutions from verified subject matter experts