

Question: PLEASE HELP IN PYTHON I ' m having a problem in my perceptron code to plot the linear decision line boundary. I have my patterns
PLEASE HELP IN PYTHON
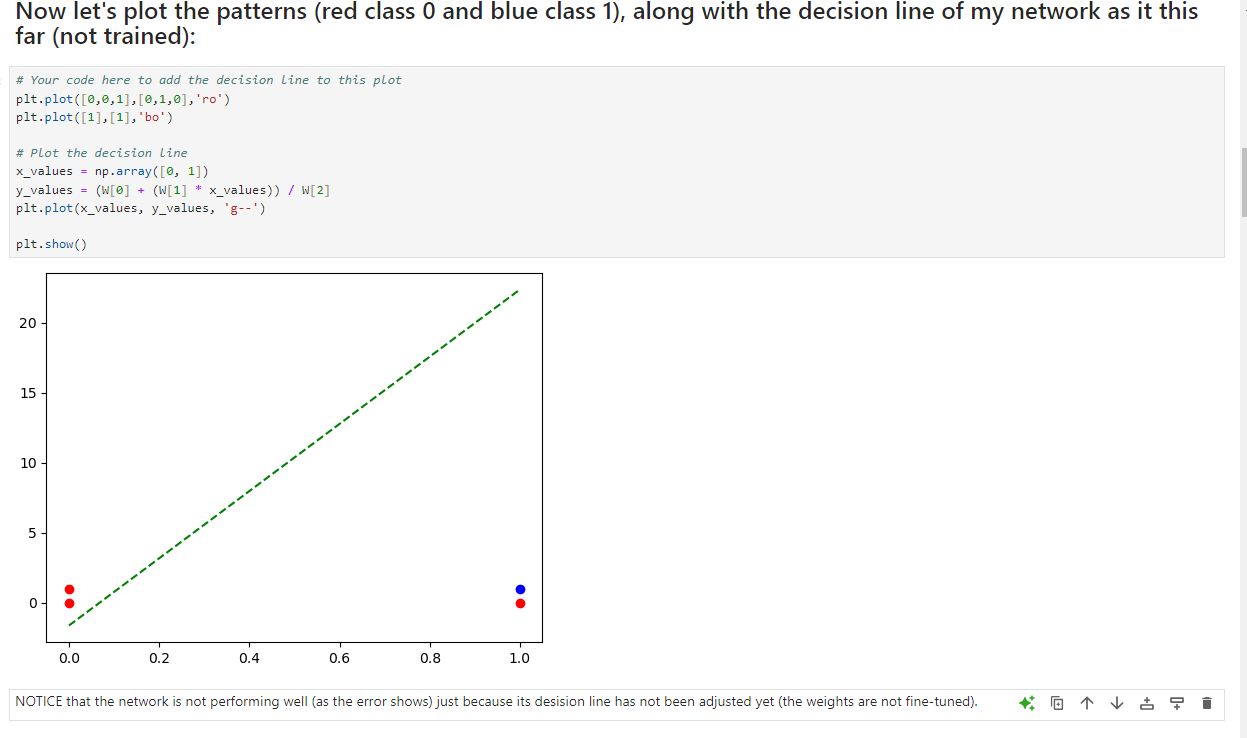
Im having a problem in my perceptron code to plot the linear decision line boundary.
I have my patterns as P nparray
I have my targets as T nparray
And I have my weights as W nparray but it can be any random number for the first two components with third one being the bias.
The red dots on the plot are represented as class but the blue dot are represented as class
pltplotro
pltplotbo
This is how I train the network.
def hardlimx:
return npwherex
A hardlimnpdotWP
E TA
rate
while sumE:
W W rate npdotE PT
A hardlimnpdotW P
E TA
How do I plot the linear decision boundary line so the network solves it flawselly. I need it so the blue dot is separated from the red dots with a linear line in the plot.
Step by Step Solution
There are 3 Steps involved in it
1 Expert Approved Answer
Step: 1 Unlock

Question Has Been Solved by an Expert!
Get step-by-step solutions from verified subject matter experts
Step: 2 Unlock
Step: 3 Unlock