

Question: Please help in Python: In this data frame, I was wondering if there was a more efficient way to calculate proportion for each column of
Please help in Python:
In this data frame, I was wondering if there was a more efficient way to calculate proportion for each column of age ranges. What method should be used?
I know that you can manually get the proportion for the column by using the total sum of the age range (i.e. total population of 0-25) divided by the total population, but it seems tedious to do for each column. Is there a efficient method that I can do in python in order to calculate proportion for all columns in one go?
code:
d = {'0-25': [1421, 2313, 3231] , '26-50': [4212, 3131, 3211], '60+': [5656, 6767, 4534], 'population': [11289, 12211, 10976]}
df = pd.DataFrame(data=d)
display(df)
Output:
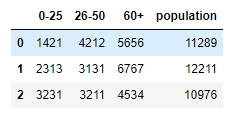
\begin{tabular}{rrrrr} & 025 & 2650 & 60+ & population \\ \hline 0 & 1421 & 4212 & 5656 & 11289 \\ 1 & 2313 & 3131 & 6767 & 12211 \\ 2 & 3231 & 3211 & 4534 & 10976 \end{tabular}
Step by Step Solution
There are 3 Steps involved in it

Get step-by-step solutions from verified subject matter experts