

Question: Please help in solving in excel. It will be easy for me to understand. Thank you Part II The market where the MOB is located
Please help in solving in excel. It will be easy for me to understand.
Thank you
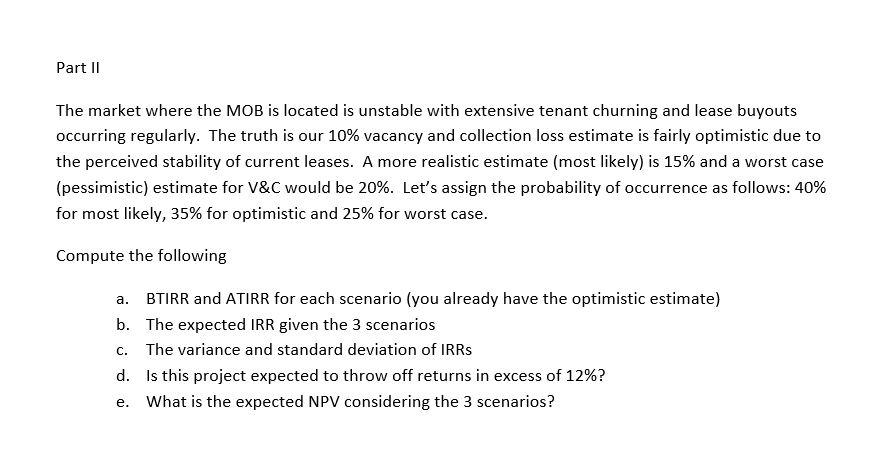
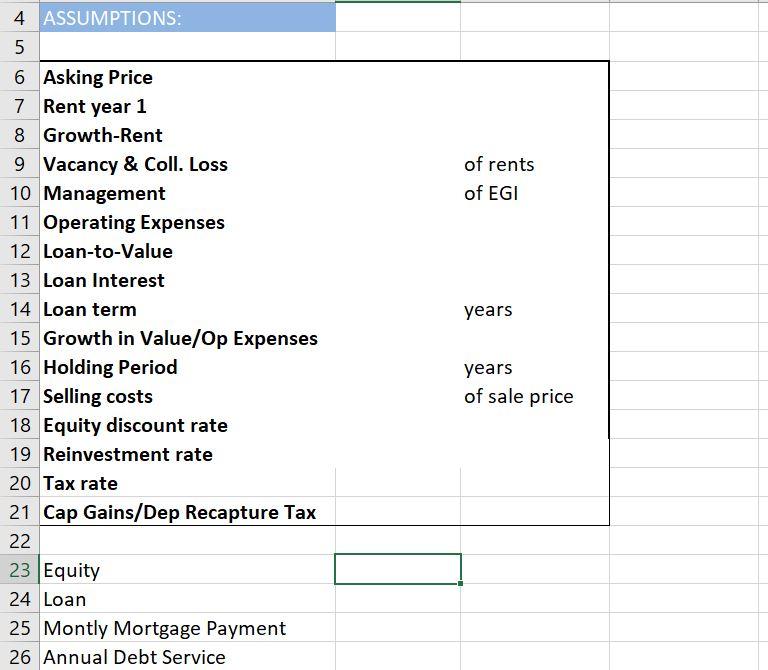
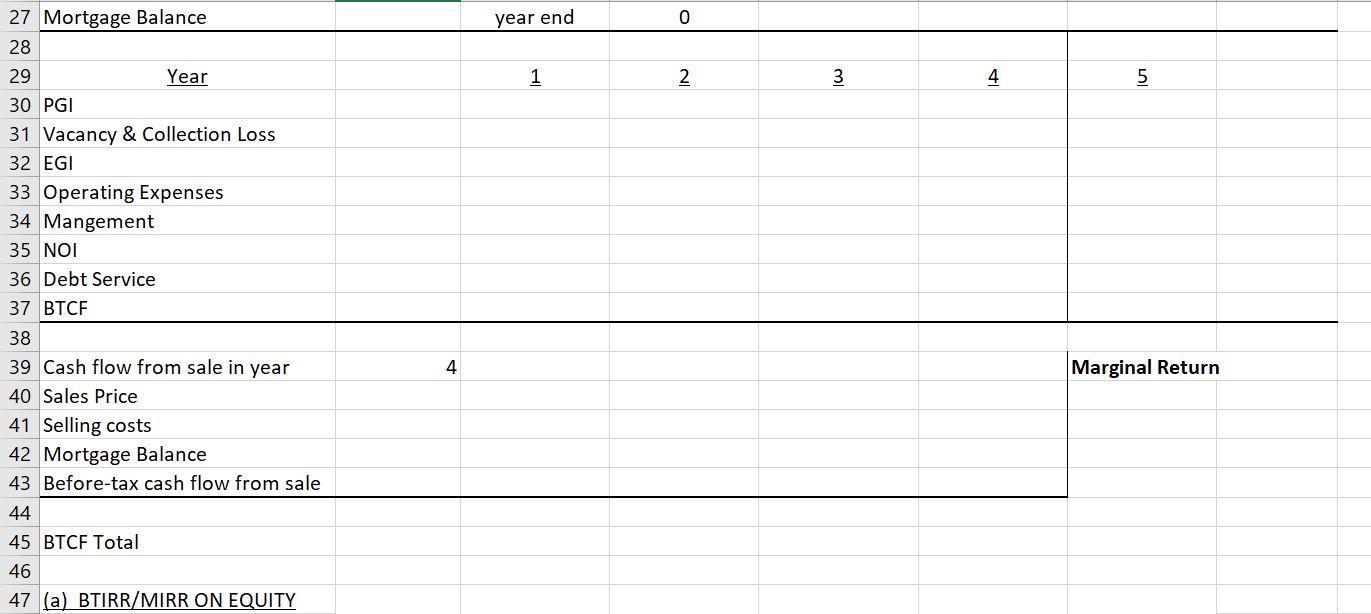
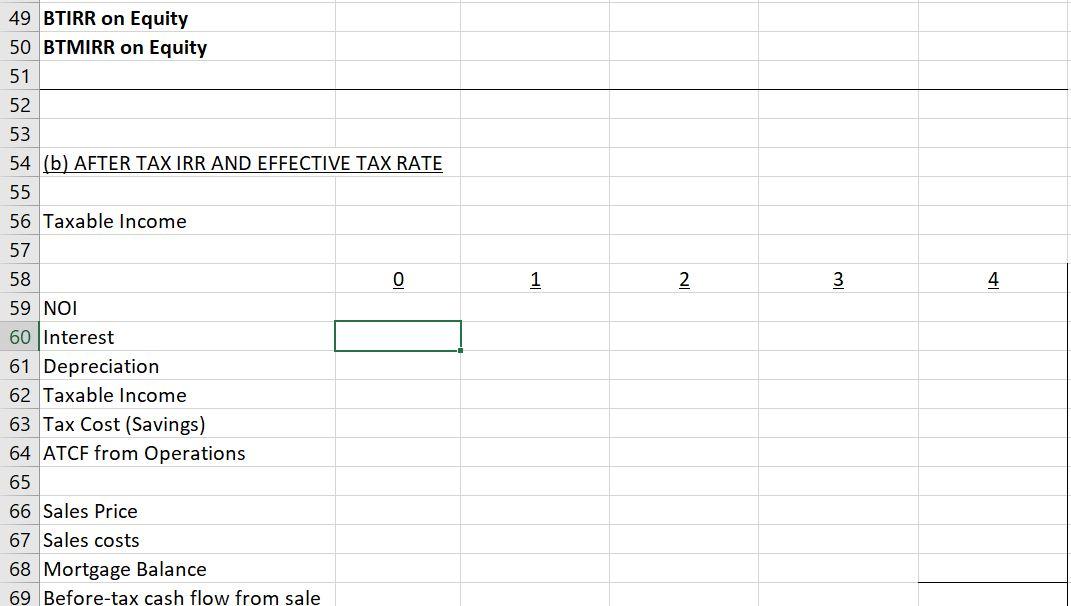
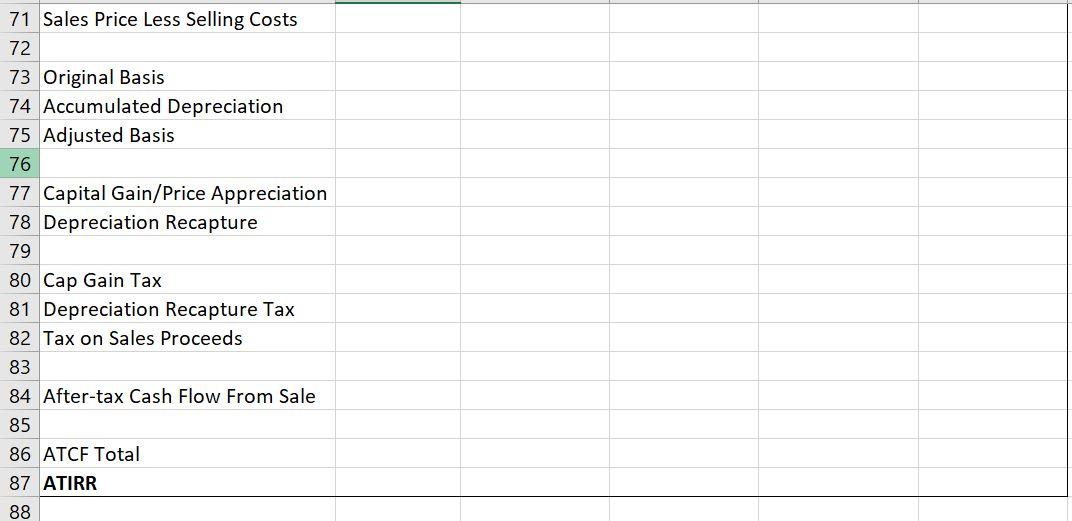
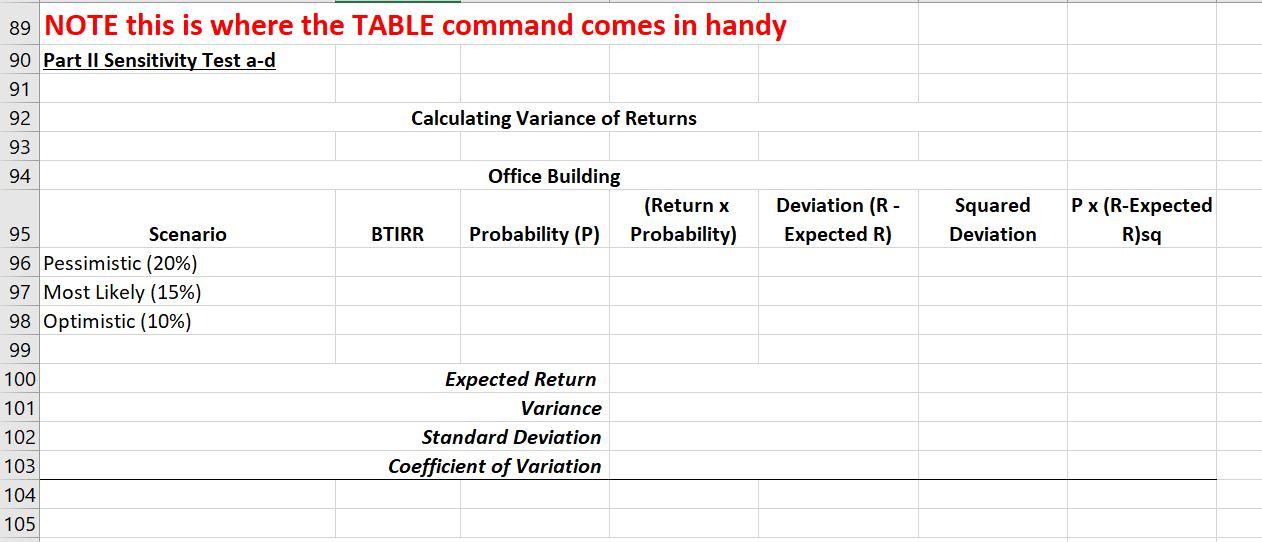
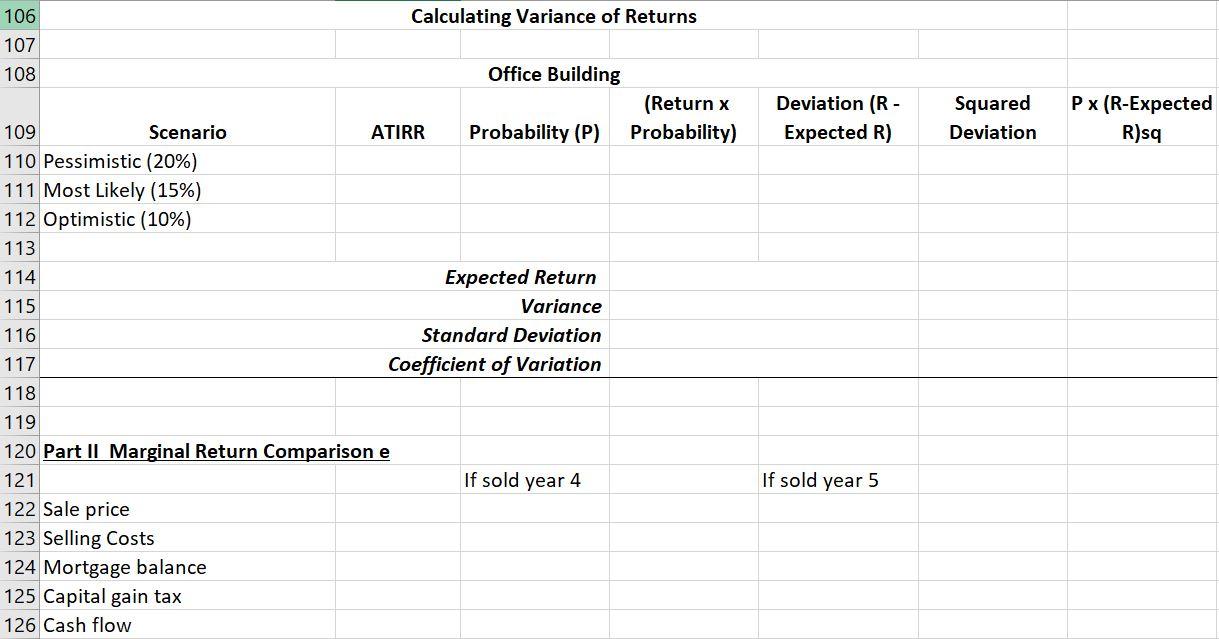
Part II The market where the MOB is located is unstable with extensive tenant churning and lease buyouts occurring regularly. The truth is our 10% vacancy and collection loss estimate is fairly optimistic due to the perceived stability of current leases. A more realistic estimate (most likely) is 15% and a worst case (pessimistic) estimate for V&C would be 20%. Let's assign the probability of occurrence as follows: 40% for most likely, 35% for optimistic and 25% for worst case. Compute the following a. BTIRR and ATIRR for each scenario (you already have the optimistic estimate) b. The expected IRR given the 3 scenarios C. The variance and standard deviation of IRRS d. Is this project expected to throw off returns in excess of 12%? e. What is the expected NPV considering the 3 scenarios? of rents of EGI years 4 ASSUMPTIONS: 5 6 Asking Price 7 Rent year 1 8 Growth-Rent 9 Vacancy & Coll. Loss 10 Management 11 Operating Expenses 12 Loan-to-Value 13 Loan Interest 14 Loan term 15 Growth in Value/Op Expenses 16 Holding Period 17 Selling costs 18 Equity discount rate 19 Reinvestment rate 20 Tax rate 21 Cap Gains/Dep Recapture Tax 22 23 Equity 24 Loan 25 Montly Mortgage Payment 26 Annual Debt Service years of sale price year end IF IN 3 4 5 27 Mortgage Balance 28 29 Year 30 PGI 31 Vacancy & Collection Loss 32 EGI 33 Operating Expenses 34 Mangement 35 NOI 36 Debt Service 37 BTCF 4 Marginal Return 38 39 Cash flow from sale in year 40 Sales Price 41 Selling costs 42 Mortgage Balance 43 Before-tax cash flow from sale 44 45 BTCF Total 46 47 (a) BTIRR/MIRR ON EQUITY 1 2 3 sti 49 BTIRR on Equity 50 BTMIRR on Equity 51 52 53 54 (b) AFTER TAX IRR AND EFFECTIVE TAX RATE 55 56 Taxable Income 57 58 0 59 NOI 60 Interest 61 Depreciation 62 Taxable income 63 Tax Cost (Savings) 64 ATCF from Operations 65 66 Sales Price 67 Sales costs 68 Mortgage Balance 69 Before-tax cash flow from sale 71 Sales Price Less Selling Costs 72 73 Original Basis 74 Accumulated Depreciation 75 Adjusted Basis 76 77 Capital Gain/Price Appreciation 78 Depreciation Recapture 79 80 Cap Gain Tax 81 Depreciation Recapture Tax 82 Tax on Sales Proceeds 83 84 After-tax Cash Flow From Sale 85 86 ATCF Total 87 ATIRR 88 Squared Deviation Px (R-Expected R)sa 89 NOTE this is where the TABLE command comes in handy 90 Part II Sensitivity Test a-d 91 92 Calculating Variance of Returns 93 94 Office Building (Return x Deviation (R- 95 Scenario BTIRR Probability (P) Probability) Expected R) 96 Pessimistic (20%) 97 Most Likely (15%) 98 Optimistic (10%) 99 100 Expected Return 101 Variance 102 Standard Deviation 103 Coefficient of Variation 104 105 Calculating Variance of Returns 106 107 108 Office Building (Return x Probability) Deviation (R- Expected R) Squared Deviation Px (R-Expected R)sq ATIRR Probability (P) 109 Scenario 110 Pessimistic (20%) 111 Most Likely (15%) 112 Optimistic (10%) 113 114 Expected Return 115 Variance 116 Standard Deviation 117 Coefficient of Variation 118 119 120 Part II Marginal Return Comparison e 121 If sold year 4 122 Sale price 123 Selling Costs 124 Mortgage balance 125 Capital gain tax 126 Cash flow If sold year 5 Part II The market where the MOB is located is unstable with extensive tenant churning and lease buyouts occurring regularly. The truth is our 10% vacancy and collection loss estimate is fairly optimistic due to the perceived stability of current leases. A more realistic estimate (most likely) is 15% and a worst case (pessimistic) estimate for V&C would be 20%. Let's assign the probability of occurrence as follows: 40% for most likely, 35% for optimistic and 25% for worst case. Compute the following a. BTIRR and ATIRR for each scenario (you already have the optimistic estimate) b. The expected IRR given the 3 scenarios C. The variance and standard deviation of IRRS d. Is this project expected to throw off returns in excess of 12%? e. What is the expected NPV considering the 3 scenarios? of rents of EGI years 4 ASSUMPTIONS: 5 6 Asking Price 7 Rent year 1 8 Growth-Rent 9 Vacancy & Coll. Loss 10 Management 11 Operating Expenses 12 Loan-to-Value 13 Loan Interest 14 Loan term 15 Growth in Value/Op Expenses 16 Holding Period 17 Selling costs 18 Equity discount rate 19 Reinvestment rate 20 Tax rate 21 Cap Gains/Dep Recapture Tax 22 23 Equity 24 Loan 25 Montly Mortgage Payment 26 Annual Debt Service years of sale price year end IF IN 3 4 5 27 Mortgage Balance 28 29 Year 30 PGI 31 Vacancy & Collection Loss 32 EGI 33 Operating Expenses 34 Mangement 35 NOI 36 Debt Service 37 BTCF 4 Marginal Return 38 39 Cash flow from sale in year 40 Sales Price 41 Selling costs 42 Mortgage Balance 43 Before-tax cash flow from sale 44 45 BTCF Total 46 47 (a) BTIRR/MIRR ON EQUITY 1 2 3 sti 49 BTIRR on Equity 50 BTMIRR on Equity 51 52 53 54 (b) AFTER TAX IRR AND EFFECTIVE TAX RATE 55 56 Taxable Income 57 58 0 59 NOI 60 Interest 61 Depreciation 62 Taxable income 63 Tax Cost (Savings) 64 ATCF from Operations 65 66 Sales Price 67 Sales costs 68 Mortgage Balance 69 Before-tax cash flow from sale 71 Sales Price Less Selling Costs 72 73 Original Basis 74 Accumulated Depreciation 75 Adjusted Basis 76 77 Capital Gain/Price Appreciation 78 Depreciation Recapture 79 80 Cap Gain Tax 81 Depreciation Recapture Tax 82 Tax on Sales Proceeds 83 84 After-tax Cash Flow From Sale 85 86 ATCF Total 87 ATIRR 88 Squared Deviation Px (R-Expected R)sa 89 NOTE this is where the TABLE command comes in handy 90 Part II Sensitivity Test a-d 91 92 Calculating Variance of Returns 93 94 Office Building (Return x Deviation (R- 95 Scenario BTIRR Probability (P) Probability) Expected R) 96 Pessimistic (20%) 97 Most Likely (15%) 98 Optimistic (10%) 99 100 Expected Return 101 Variance 102 Standard Deviation 103 Coefficient of Variation 104 105 Calculating Variance of Returns 106 107 108 Office Building (Return x Probability) Deviation (R- Expected R) Squared Deviation Px (R-Expected R)sq ATIRR Probability (P) 109 Scenario 110 Pessimistic (20%) 111 Most Likely (15%) 112 Optimistic (10%) 113 114 Expected Return 115 Variance 116 Standard Deviation 117 Coefficient of Variation 118 119 120 Part II Marginal Return Comparison e 121 If sold year 4 122 Sale price 123 Selling Costs 124 Mortgage balance 125 Capital gain tax 126 Cash flow If sold year 5
Step by Step Solution
There are 3 Steps involved in it

Get step-by-step solutions from verified subject matter experts