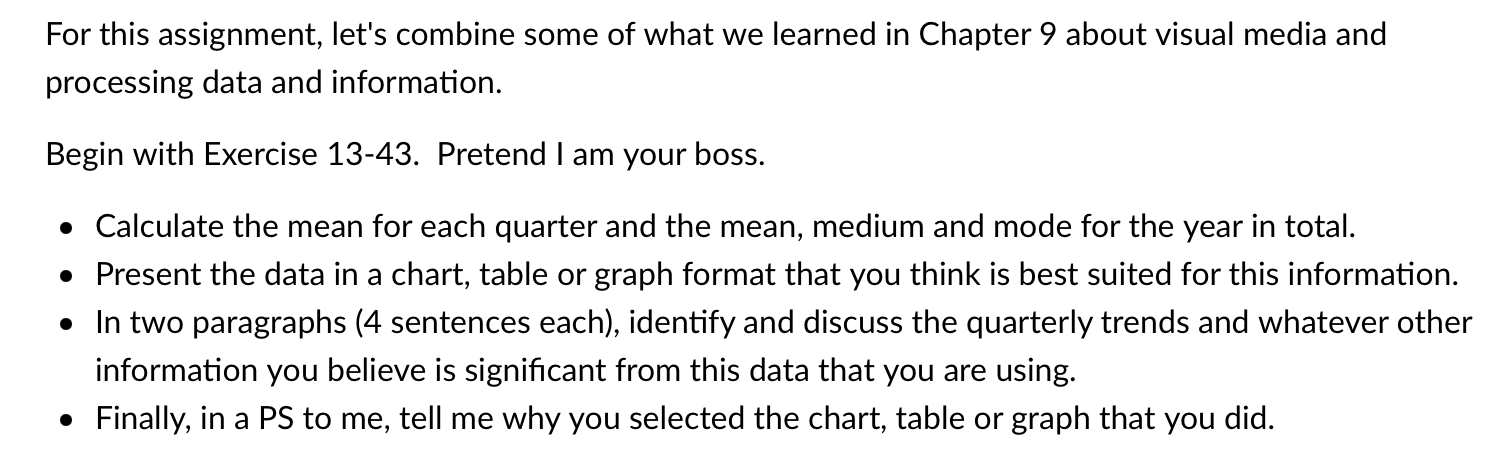
Question: please help instructions are attached. please don't copies a previous cheggs work For this assignment, let's combine some of what we learned in Chapter 9

please help instructions are attached. please don't copies a previous cheggs work

please help instructions are attached. please

please help instructions are attached. please

For this assignment, let's combine some of what we learned in Chapter 9 about visual media and processing data and information. Begin with Exercise 13-43. Pretend I am your boss. - Calculate the mean for each quarter and the mean, medium and mode for the year in total. - Present the data in a chart, table or graph format that you think is best suited for this information - In two paragraphs (4 sentences each), identify and discuss the quarterly trends and whatever othe information you believe is significant from this data that you are using. - Finally, in a PS to me, tell me why you selected the chart, table or graph that you did. 13-43. Processing Data and Information [LO-4] Your boss has asked you to analyze and report on your division's sales for the first nine months of this year. Using the following data from company invoices, calculate the mean for each quarter and all averages for the year to date. Then identify and discuss the quarterly sales trends

Step by Step Solution

There are 3 Steps involved in it

1 Expert Approved Answer
Step: 1 Unlock blur-text-image
Question Has Been Solved by an Expert!

Get step-by-step solutions from verified subject matter experts

Step: 2 Unlock
Step: 3 Unlock

Students Have Also Explored These Related General Management Questions!