Question: Please help. I've posted this question multiple times and still yet to receive a complete answer. Thank you! Shoney Video Concepts produces a line of
Please help. I've posted this question multiple times and still yet to receive a complete answer. Thank you!
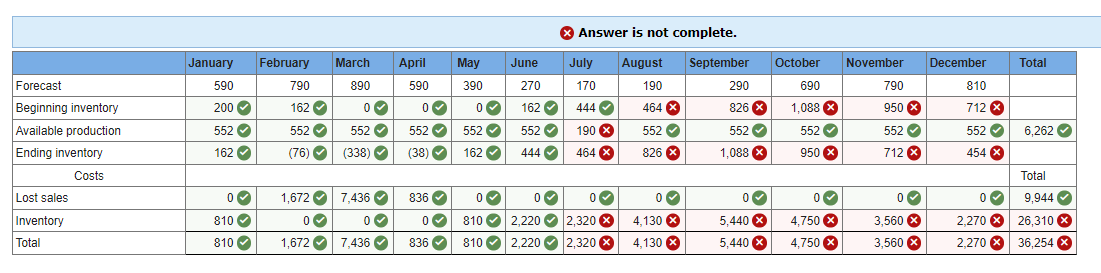
Shoney Video Concepts produces a line of video streaming servers that are linked to personal computers for storing movies. These devices have very fast access and large storage capacity. Shoney is trying to determine a production plan for the next 12 months. The main criterion for this plan is that the employment level is to be held constant over the period. Shoney is continuing in its R&D efforts to develop new applications and prefers not to cause any adverse feelings with the local workforce. For the same reason, all employees should put in full workweeks, even if this is not the lowest-cost alternative. The forecast for the next 12 months is MONTH January February March April May June FORECAST DEMAND 590 790 890 590 390 270 MONTH July August September October November December FORECAST DEMAND 170 190 290 690 790 810 Manufacturing cost is $200 per server, equally divided between materials and labor. Inventory storage cost is $5 per unit per month and is assigned based on the ending inventory level. A shortage of servers results in lost sales and is estimated to cost an overall $22 per unit short The inventory on hand at the beginning of the planning period is 200 units. Ten labor hours are required per DVD player. The workday is eight hours. Develop an aggregate production schedule for the year using a constant workforce. For simplicity, assume 23 working days each month except July, when the plant closes down for three weeks' vacation (leaving eight working days). Assume that total annual production capacity is greater than or equal to total annual demand (i.e., compute workforce level based on annual demand and annual capacity). (Leave no cells blank - be certain to enter "0" wherever required. Indicate monthly shortages using a negative ending inventory level. Round up the "number of workers" to the next whole number and round down your monthly "Available production" values to the nearest whole number.) Answer is not complete. February March June January 590 200 April 590 August 190 September 290 October 690 November 790 790 July 170 444 Forecast Beginning inventory 270 890 0 0 162 May 390 0 552 162 0 464 X 1,088 X 950 162 552 826 X 552 552 552 190 X 552 552 552 Available production Ending inventory 552 (338) 552 (38) 162 (76) 444 464 826 X 1,088 X 950 X 712X December Total 810 712 552 6,262 454 Total 0 9,944 2,270 % 26,310 X 2,270 X 36,254 X Costs 836 0 0 Lost sales Inventory Total 0 0 810 810 1,6727,436 0 0 1,6727,436 0 0 0 0 0 810 2,220 2,320 X 2,320 4,130 810 2,220 2,320 X 4,130 X 0 0 3,560 X 0 5,440 X 4,750 X 4,750 X 836 5,440 X 3,560


