

Question: Please help. JMP is not working properly. Part II: Using Actual Data and Technology Note: Age of Car is not just limited to how long
Please help. JMP is not working properly.
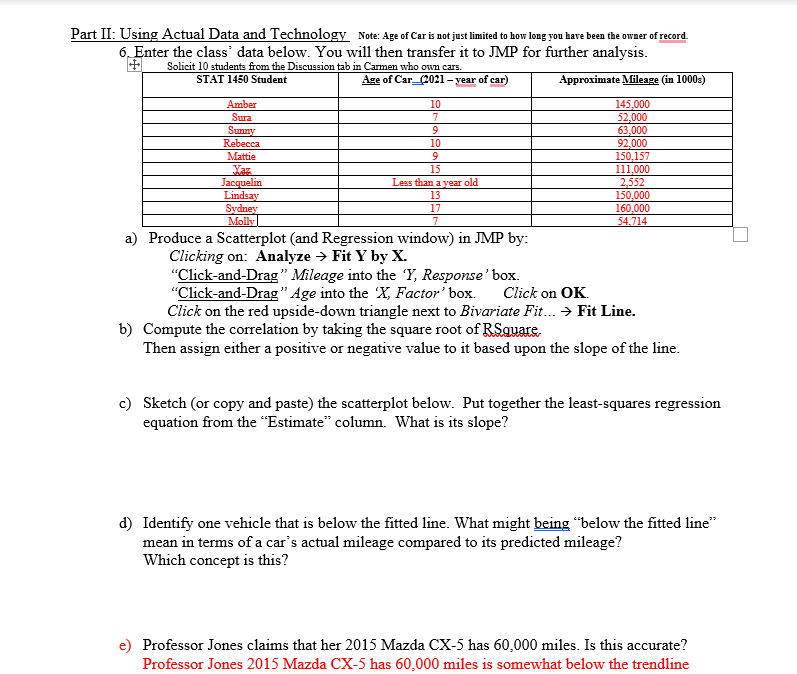
Part II: Using Actual Data and Technology Note: Age of Car is not just limited to how long you have been the owner of record. 6. Enter the class' data below. You will then transfer it to JMP for further analysis Solicit 10 students from the Discussion tab in Carmen who own cars. STAT 1450 Student Age of Car_(2021 - year of car) Approximate Mileage (in 10003) Amber 10 45,000 Sura $2,000 Sunny 3,000 Rebecca 10 #2,000 Mattie 150,157 Kaz 15 111,000 Jacquelin Less than a year old 2,552 Lindsay 13 150,000 Sydney 17 60.000 Molly 54.714 a) Produce a Scatterplot (and Regression window) in JMP by: Clicking on: Analyze > Fit Y by X. "Click-and-Drag" Mileage into the 'Y, Response' box. "Click-and-Drag" Age into the 'X, Factor' box. Click on OK. Click on the red upside-down triangle next to Bivariate Fit... > Fit Line. b) Compute the correlation by taking the square root of R.Square. Then assign either a positive or negative value to it based upon the slope of the line. c) Sketch (or copy and paste) the scatterplot below. Put together the least-squares regression equation from the "Estimate" column. What is its slope? d) Identify one vehicle that is below the fitted line. What might being "below the fitted line" mean in terms of a car's actual mileage compared to its predicted mileage? Which concept is this? e) Professor Jones claims that her 2015 Mazda CX-5 has 60,000 miles. Is this accurate? Professor Jones 2015 Mazda CX-5 has 60,000 miles is somewhat below the trendline
Step by Step Solution
There are 3 Steps involved in it

Get step-by-step solutions from verified subject matter experts