

Question: Please help!!! Mailings Review View Help Design Layout Search to EEES AL AaBb AaBbc AaBbCc AaBbc 1 Heading 1 Heading 2 1 Heading 3 1
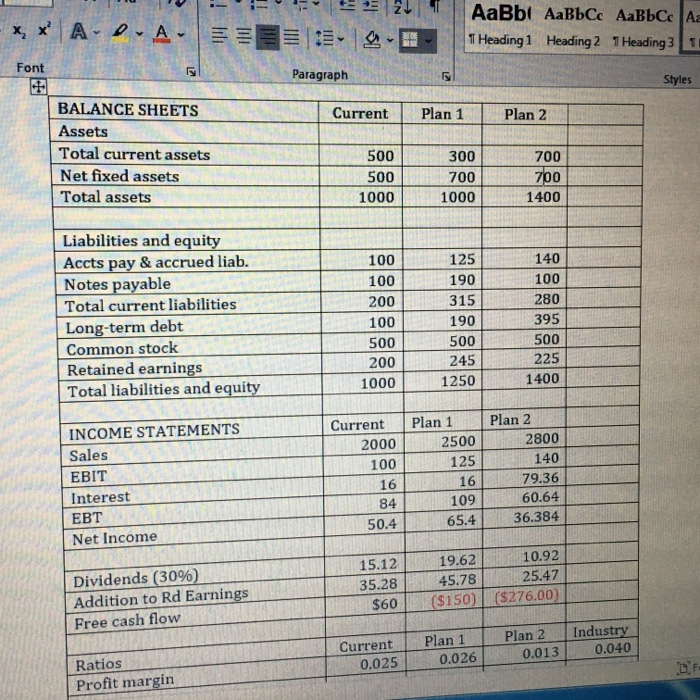
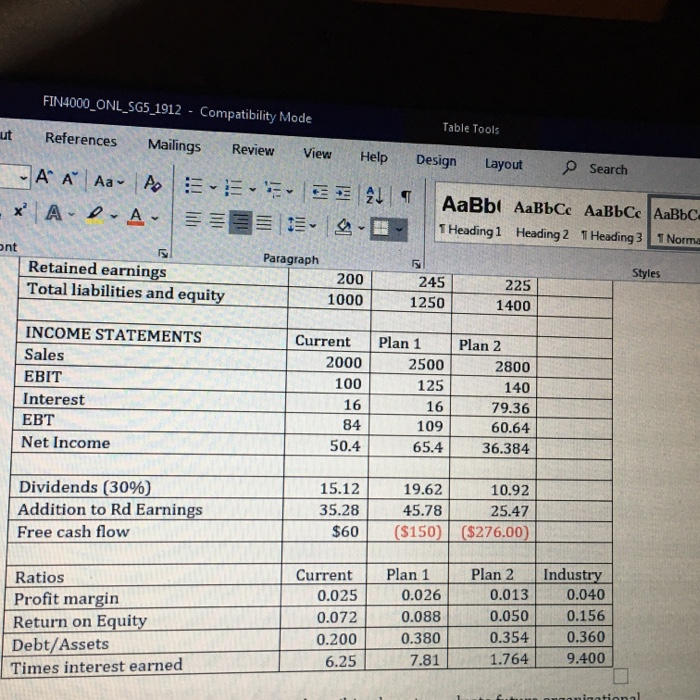
Mailings Review View Help Design Layout Search to EEES AL AaBb AaBbc AaBbCc AaBbc 1 Heading 1 Heading 2 1 Heading 3 1 Norm A Paragraph Styles Grace & Bells Company is evaluating plans for the coming year. Review the following data for the current year and plans 1 and 2. Dollar amounts are given in thousands of dollars. li IM IN x, x' ADA AaBbt AaBbCc AaBbCc Az Heading 1 Heading 2 1 Heading 3 11 Font Paragraph Styles Current Plan 1 Plan 2 BALANCE SHEETS Assets Total current assets Net fixed assets Total assets 500 500 1000 300 700 1000 700 700 1400 Liabilities and equity Accts pay & accrued liab. Notes payable Total current liabilities Long-term debt Common stock Retained earnings Total liabilities and equity 100 100 200 100 500 200 1000 125 190 315 190 500 245 1250 140 100 280 395 500 225 1400 Current 2000 100 INCOME STATEMENTS Sales EBIT Interest EBT Net Income Plan 1 2500 125 16 109 65.4 Plan 2 2800 140 79.36 60.64 36.384 16 84 50.4 Dividends (30%) Addition to Rd Earnings Free cash flow 15.12 35.28 $60 19.62 10.92 45.78 25.47 ($150 ($276.00 Current 0.025 Plan 1 0.026 Plan 2 0.013 Industry 0.040 Ratios Profit margin FIN4000_ONL_SG5_1912 - Compatibility Mode Table Tools ut References Mailings Review View Help Design Layout O Search A A Aa A EEE3419 * A.D.A. AaBb AaBbCc AaBb Cc AaBbc 1 Heading1 Heading 2 T Heading 31 Norma ont Paragraph Retained earnings Total liabilities and equity Styles 200 1000 245 1250 225 1400 INCOME STATEMENTS Sales EBIT Interest Net Income Current 2000 100 16 84 50.4 Plan 1 2500 125 16 109 65.4 Plan 2 2800 140 79.36 60.64 36.384 Dividends (30%) Addition to Rd Earnings Free cash flow 15.12 35.28 $60 19.62 10.92 45.78 25.47 ($150) ($276.00) Ratios Profit margin Return on Equity Debt/Assets Times interest earned Current 0.025 0.072 0.200 6.25 Plan 1 0.026 0.088 0.380 7.81 Plan 2 0.013 0.050 0.354 1.764 Industry 0.040 0.156 0.360 9.400 animational o Do you recommend either plan 1 or plan 2 for Grace & Bell Company and why? Support you answer citing the projected outcomes from the case and the concepts that you have studied in this course. o Address the impact of growth on future performance. Is the maximum growth possible always the best? Why? Support you answer citing the projected outcomes from the case and the concepts that you have studied in this course
Step by Step Solution
There are 3 Steps involved in it

Get step-by-step solutions from verified subject matter experts