

Question: please help!!! managing quality & continuous improvement + Date Part 1 Part 2 Part 3 Part 4 Part 5 8-Oct 91 106 110 91 109
please help!!! managing quality & continuous improvement 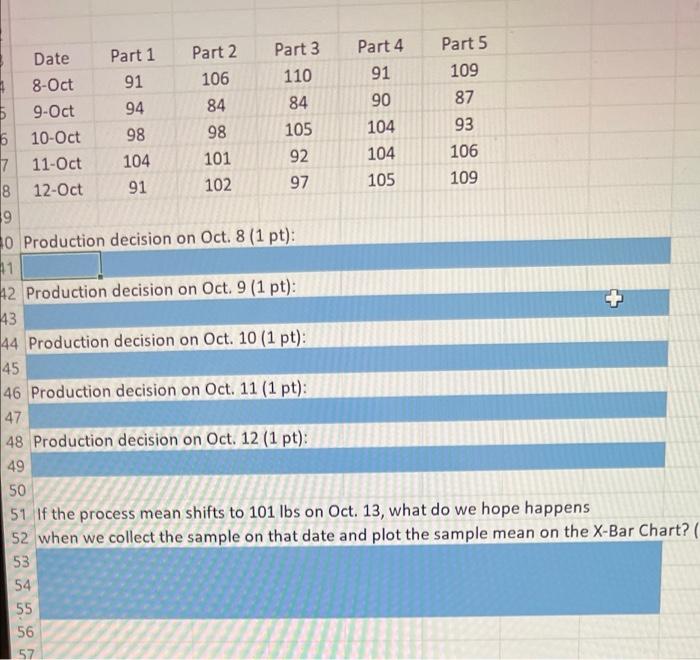
+ Date Part 1 Part 2 Part 3 Part 4 Part 5 8-Oct 91 106 110 91 109 9-Oct 5 94 84 84 87 90 5 10-Oct 98 98 105 104 93 7 11-Oct 104 101 92 104 106 8 12-Oct 91 102 97 105 109 9 30 Production decision on Oct. 8 (1 pt): 11 42 Production decision on Oct. 9 (1 pt): 43 44 Production decision on Oct. 10 (1 pt): 45 46 Production decision on Oct. 11 (1 pt): 47 48 Production decision on Oct. 12 (1 pt): 49 50 51 If the process mean shifts to 101 lbs on Oct. 13, what do we hope happens 52 when we collect the sample on that date and plot the sample mean on the X-Bar Chart? ( 53 54 55 56 57 Display the X-Bar Chart monitoring the process from Oct. 8 to Oct. 12 (2 points) Display the R Chart monitoring the process from Oct. 8 to Oct 12 (2 points) + 1 + Date Part 1 Part 2 Part 3 Part 4 Part 5 8-Oct 91 106 110 91 109 9-Oct 5 94 84 84 87 90 5 10-Oct 98 98 105 104 93 7 11-Oct 104 101 92 104 106 8 12-Oct 91 102 97 105 109 9 30 Production decision on Oct. 8 (1 pt): 11 42 Production decision on Oct. 9 (1 pt): 43 44 Production decision on Oct. 10 (1 pt): 45 46 Production decision on Oct. 11 (1 pt): 47 48 Production decision on Oct. 12 (1 pt): 49 50 51 If the process mean shifts to 101 lbs on Oct. 13, what do we hope happens 52 when we collect the sample on that date and plot the sample mean on the X-Bar Chart? ( 53 54 55 56 57 Display the X-Bar Chart monitoring the process from Oct. 8 to Oct. 12 (2 points) Display the R Chart monitoring the process from Oct. 8 to Oct 12 (2 points) + 1
Step by Step Solution
There are 3 Steps involved in it
1 Expert Approved Answer
Step: 1 Unlock

Question Has Been Solved by an Expert!
Get step-by-step solutions from verified subject matter experts
Step: 2 Unlock
Step: 3 Unlock