

Question: Please Help Me 3. You will answer the following question through your two variable analysis: Does paying women more benet our society? a. State a
Please Help Me
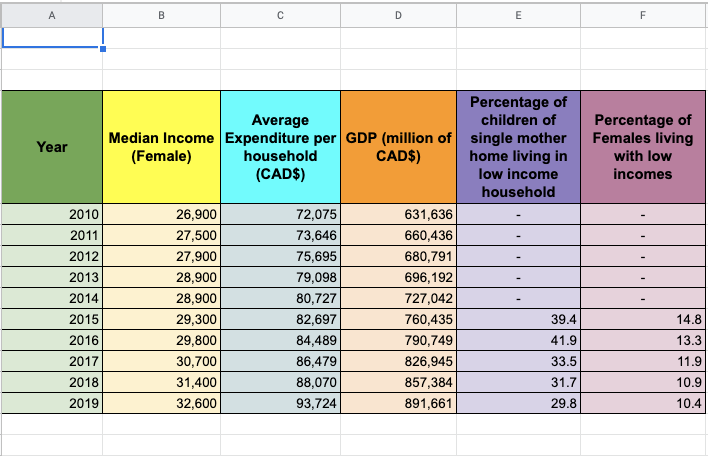
3. You will answer the following question through your two variable analysis: Does paying women more benet our society? a. State a Hypothesis (If..., then...) b. Graphing: Make as many linear graphs as you feel necessary to thoroughly answer the question posed and prove or disprove your hypothesis. c. Describe the correlation for each of your graphs in terms of strength and direction. d. Draw conclusions using statistical evidence from your graphs. Was your hypothesis correct? How do you know? CPT Part D: Reection 4. Identify any assumptions, limitations and ideas for future study. A B C D E F Percentage of Average children of Percentage of Year Median Income | Expenditure per| GDP (million of single mother Females living (Female) household CAD$) home living in with low (CAD$) low income incomes household 2010 26,900 72,075 631,636 2011 27,500 73,646 660.436 2012 27,900 75,695 680,791 2013 28,900 79,098 696, 192 2014 28,900 80,727 727,042 2015 29,300 82,697 760,435 39.4 14.8 2016 29,800 84.489 790,749 41.9 13.3 2017 30,700 86,479 826,945 33.5 11.9 2018 31,400 88,070 857,384 31.7 10.9 2019 32,600 93,724 891,661 29.8 10.4
Step by Step Solution
There are 3 Steps involved in it

Get step-by-step solutions from verified subject matter experts