

Question: Please help me 9223 4 Ch 4 Measures Fo Ch 4 Measures For Variability 1. A population has a mean of y: 80 and a
Please help me
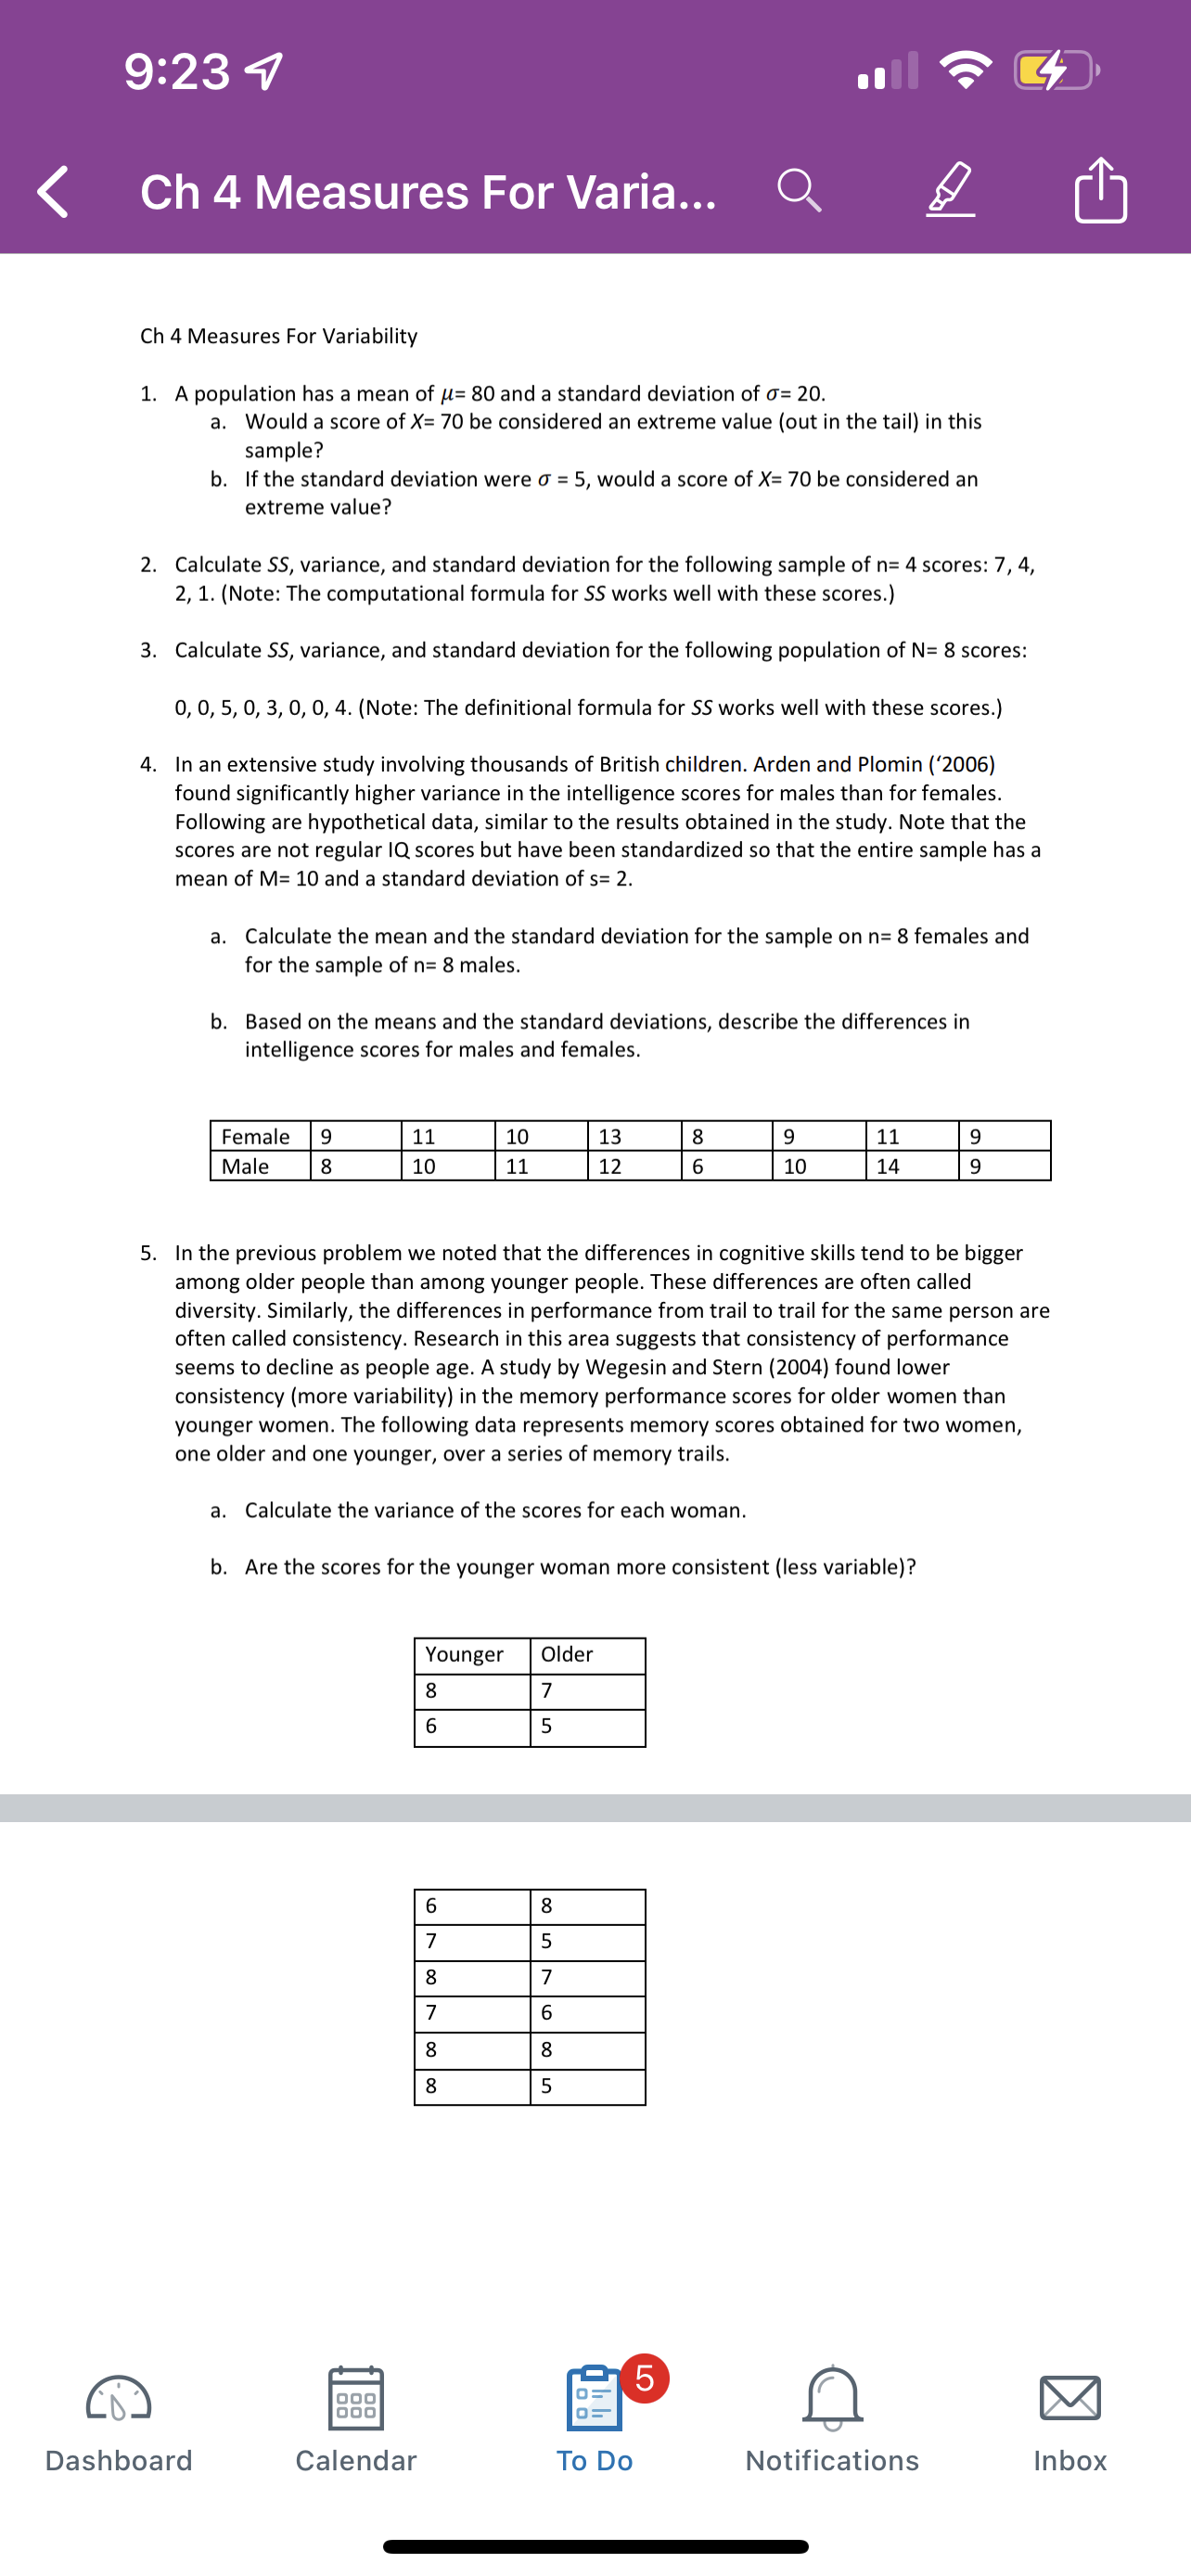
9223 4 Ch 4 Measures Fo Ch 4 Measures For Variability 1. A population has a mean of y: 80 and a standard deviation of a: 20. a. Would a score ofX= 70 be considered an extreme value (out in the tail) in this sample? b. If the standard deviation were 0' = 5, would a score of X: 70 be considered an extreme value? 2. Calculate SS, variance, and standard deviation for the following sample of n: 4 scores: 7, 4, Z, 1. (Note: The computational formula for 55 works well with these scores.) 3. Calculate $5, variance, and standard deviation for the following population of N= 8 scores: 0, O, 5, O, 3, O, O, 4. (Note: The definitional formula for 55 works well with these scores.) 4. In an extensive study involving thousands of British Children. ArdEH and Plomin ('2006) found signicantly higher variance in the intelligence scores for males than for females. Following are hypothetical data, similar to the results obta ined in the study. Note that the scores are not regular IQ scores but have been standardized so that the entire sample has a mean of M: 10 and a standard deviation of s: 2. a. Calculate the mean and the standard deviation for the sample on n= 8 females and for the sample of n= 8 males. b. Based on the means and the standard deviations, describe the differences in intelligence scores for males and females. Male mm- 10 11 12 6 10 14 5. In the previous problem we noted that the differences in cognitive skills tend to be bigger among older people than among younger people. These differences are often called diversity. Similarly, the differences in performance from trail to trail for the same person are often called consistency. Research in this area suggests that consistency of performance seems to decline as people age. A study by Wegesin and Stern (2004) found lower consistency (more variability) in the memory performance scores for older women than younger women. The following data represents memory scores obtained for two women, one older and one younger, over a series of memory trails. 3. Calculate the variance of the scores for each woman. b. Are the scores forthe younger woman more consistent (less variable)? 7 oooouooum UlmOIKIUlm '5' 1 '3' Dashboard Calendar To Do Notifications Inbox
Step by Step Solution
There are 3 Steps involved in it

Get step-by-step solutions from verified subject matter experts