

Question: Please help me. ALL THE STEPS ARE SHOWN. GRAPH BELOW AND QUESTIONS ADVANCED ANALYSIS Given the following diagrams: Q1 = 16 bags, Q2 = 11
Please help me. ALL THE STEPS ARE SHOWN. GRAPH BELOW AND QUESTIONS
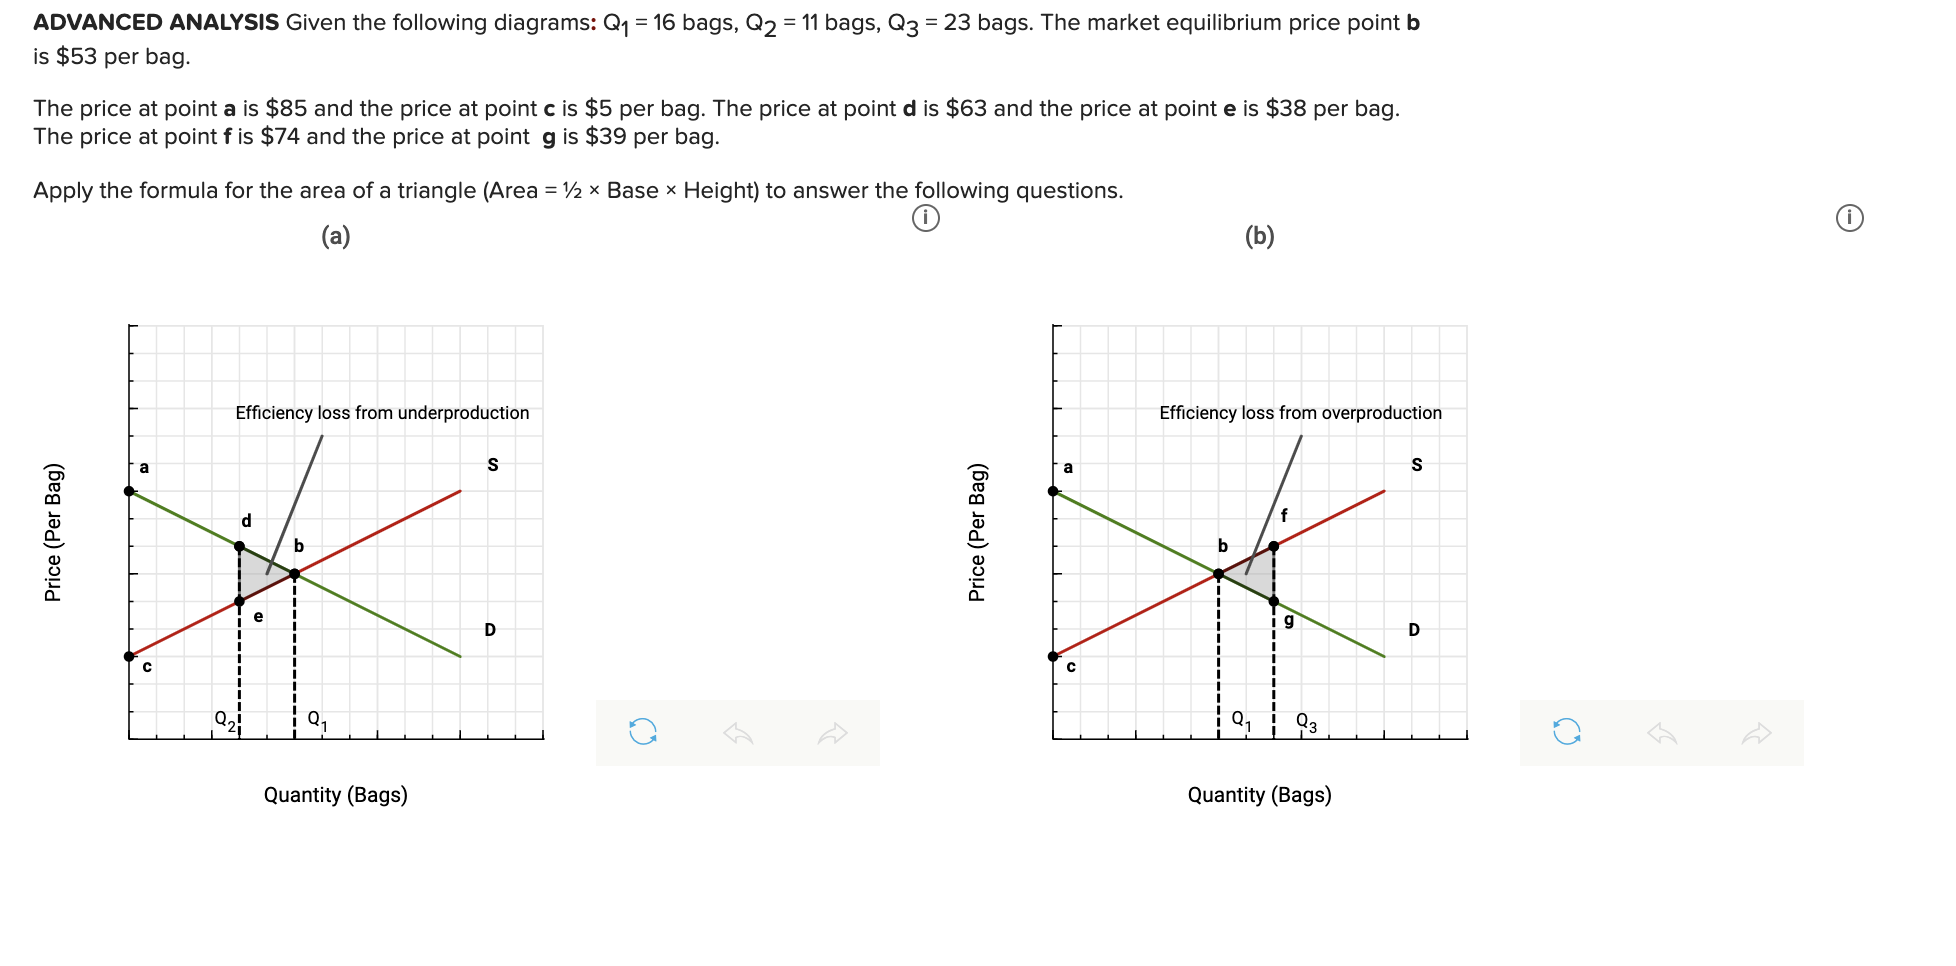
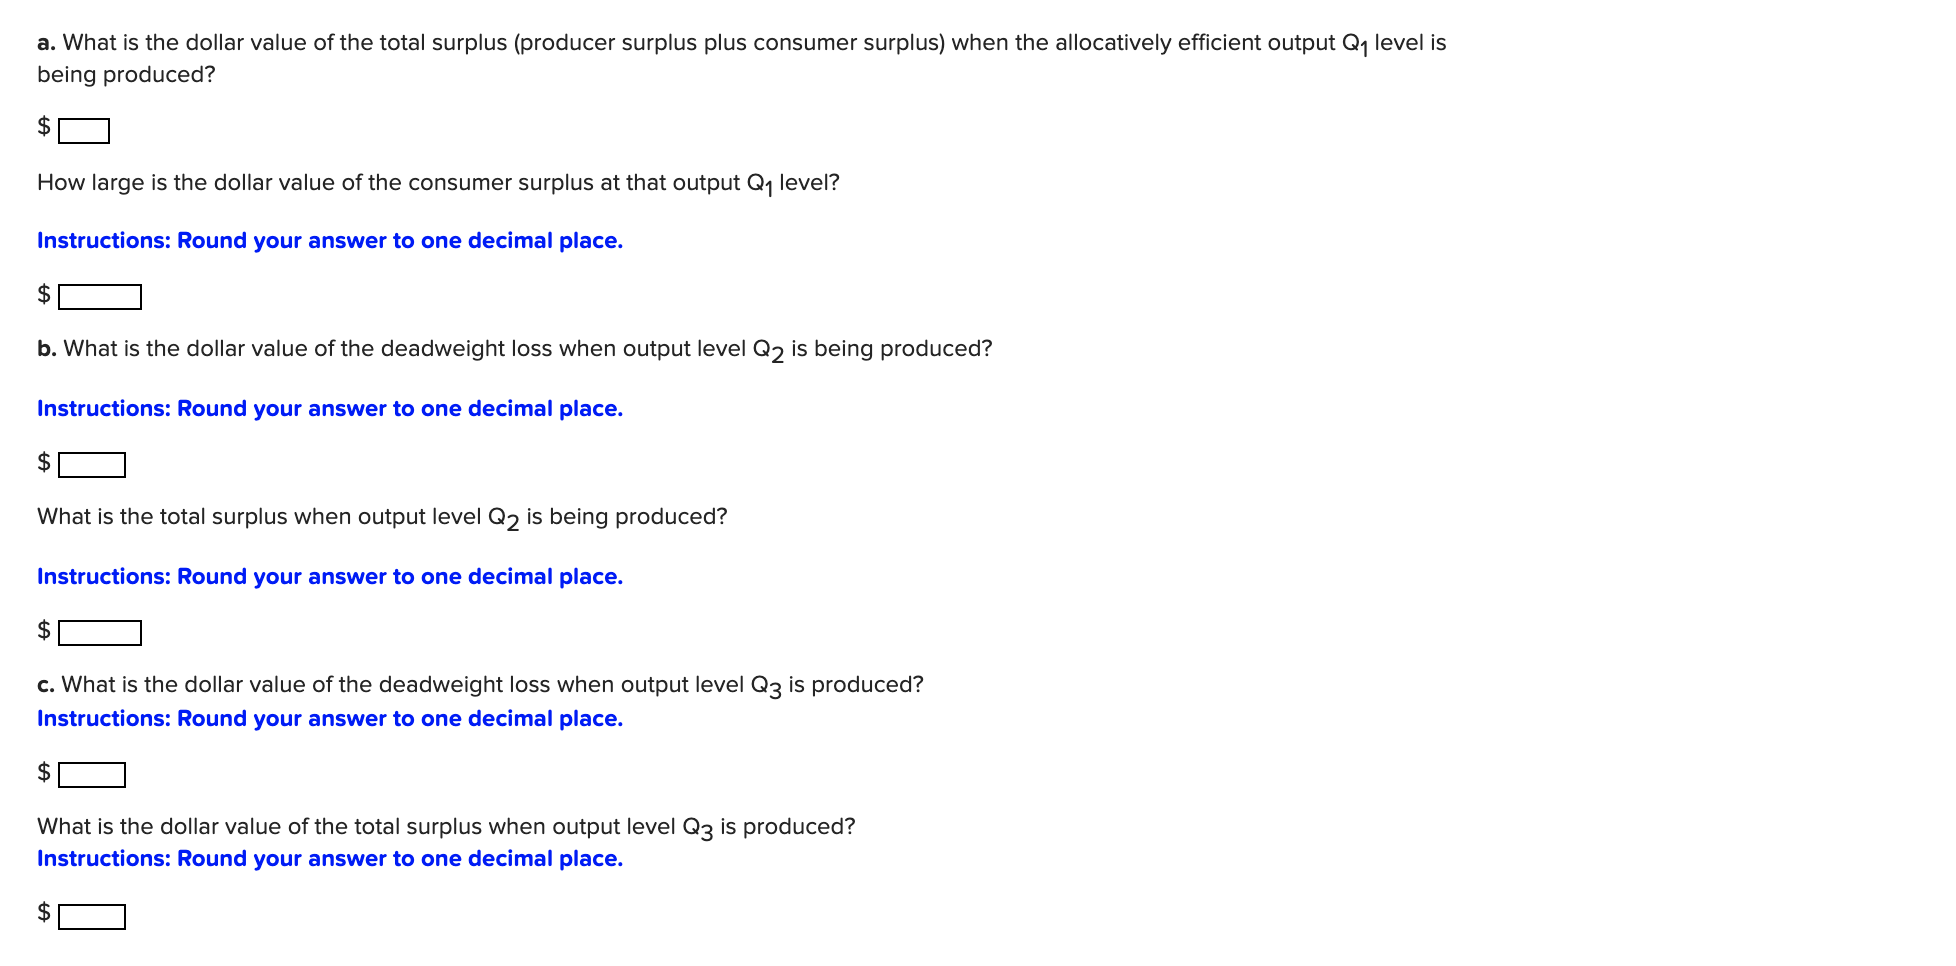
ADVANCED ANALYSIS Given the following diagrams: Q1 = 16 bags, Q2 = 11 bags, Q3 = 23 bags. The market equilibrium price point b is $53 per bag. The price at point a is $85 and the price at point c is $5 per bag. The price at point d is $63 and the price at point e is $38 per bag. The price at point f is $74 and the price at point g is $39 per bag. Apply the formula for the area of a triangle (Area = 1/2 x Base x Height) to answer the following questions. (a) (b) Efficiency loss from underproduction Efficiency loss from overproduction Price (Per Bag) a S Price (Per Bag) a S d D g D Q1 Q1 Q3 Quantity (Bags) Quantity (Bags)a. What is the dollar value of the total surplus (producer surplus plus consumer surplus) when the allocationy efficient output Q1 level is being produced? $ How large is the dollar value of the consumer surplus at that output Q1 level? Instructions: Round your answer to one decimal place. $ b. What is the dollar value of the deadweight loss when output level Q2 is being produced? Instructions: Round your answer to one decimal place. $ What is the total surplus when output level Q2 is being produced? Instructions: Round your answer to one decimal place. c. What is the dollar value of the deadweight loss when output level Q3 is produced? Instructions: Round your answer to one decimal place. What is the dollar value of the total surplus when output level Q3 is produced? Instructions: Round your answer to one decimal place. $
Step by Step Solution
There are 3 Steps involved in it

Get step-by-step solutions from verified subject matter experts