

Question: Please help me answer a-f Under Required . Module 3 I Profitability Analysis and interpretation 3-44 Analysis and Interpretation of Profitability Balance sheets and income
Please help me answer a-f Under Required.
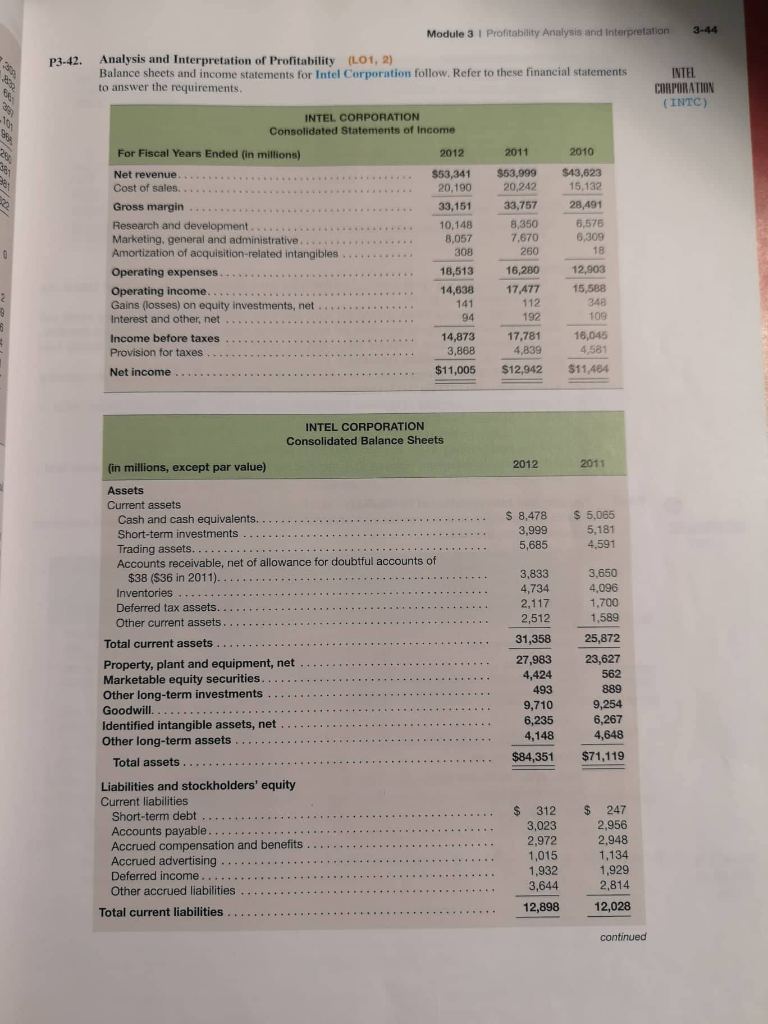
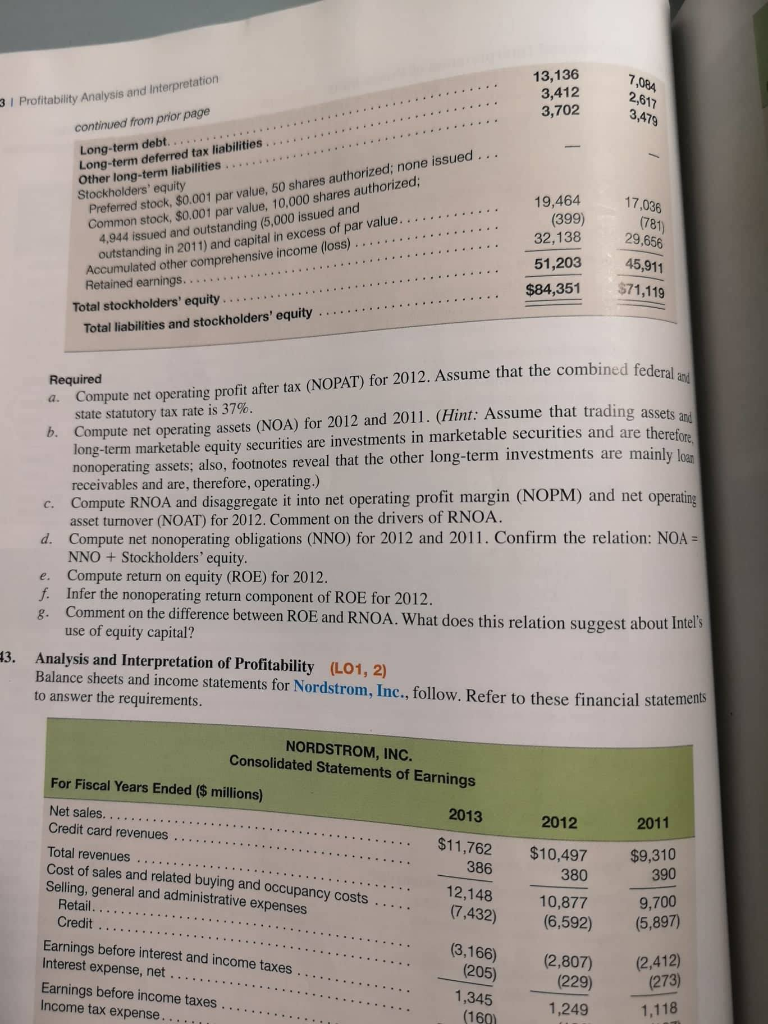
Module 3 I Profitability Analysis and interpretation 3-44 Analysis and Interpretation of Profitability Balance sheets and income statements for Intel Corporation follow. Refer to these financial statements to answer the requirements P3-42. (LO1,2) INTEL CORPORATION (INTC) INTEL CORPORATION Consolidated Statements of Income For Fiscal Years Ended (in millions Net revenue Cost of sales. Gross margin Research and development Marketing, general and administrative Amortization of acquisition-related intangibles Operating expenses.. Operating income 2010 $53,341$53,999 $43,623 20,242 33,151 33,757 15,132 28,491 6,576 10,148 7,670 18,513 14,638 260 16,280 17,477 Interest and other, net Income before taxes Provision for taxes Net income 17,781 4,839 4,581 $11,005 $12,942 $11484 INTEL CORPORATION Consolidated Balance Sheets millions, except par value) Current assets $8,478 5,065 5,181 Cash and cash equivalents. Short-term investments Trading assets. Accounts receivable, net of allowance for doubtful accounts of 3,999 3,833 3.650 $38 ($36 in 2011). Deferred tax assets Other current assets 2 25,872 Total current assets Property, plant and equipment, net Marketable equity securities 27,983 23,627 Identified intangible assets, net Other long-term assets.. 6,267 4,648 Total assets ....$84,351 $71,119 Liabilities and stockholders' equity Current liabilities $ 312 $247 2,956 2,948 Short-term debt 3,023 2,972 Accounts payable Accrued advertising Other accrued liabilities 3,644 12,898 Total current liabilities 13,136 3,412 3 I Profitability Analysis and Interpretation 2,817 3,702 28, continued from prior page Long-term debt Long-term deferred tax liabilities Other long-term liabilities Stockholders' equity stook, $0.001 par value, 50 shares authorized; none issued stock, $0.001 par value, 10,000 shares authorized; Preferred .. . .19,464 4,944 issued and outstanding (5,000 issued and .32,138 Accumulated other comprehensive income (loss) Retained earnings outstanding in 2011) and capital in excess of par value. 51,203 45,911 Total stockholders' equity... .. . .$84,351 Total liabilities and stockholders' equity me that the combined federal a Required a. Compute net operating profit after tax (NOPAT) for 2012. Assu state statutory tax rate is 37% long-term marketable equity securities are investments in marketable securities and are theref nonoperating assets; also, footnotes reveal that the other long-term investments are mainly receivables and are, therefore, operating.) b. Compute net operating assets (NOA) for 2012 and 2011. (Hint: Assume that trading as ore c. Compute RNOA and disaggregate it into net operating profit margin (NOPM) and net operating d. Compute net nonoperating obligations (NNO) for 2012 and 2011. Confirm the relation: NOA- e. Compute return on equity (ROE) for 2012. asset turnover (NOAT) for 2012. Comment on the drivers of RNOA. NNO + Stockholders' equity Infer the nonoperating return component of ROE for 2012 Comment on the difference between ROE and RNOA. What does this relation suggest about Intel's use of equity capital? f. 13. Analysis and Interpretation of Profitability Balance sheets and income statements for Nordstrom, Inc., follow. Refer to these financial statements to answer the requirements. (LO1, 2) NORDSTROM, INC Consolidated Statements of Earnings For Fiscal Years Ended ($ millions) Net sales. 2013 $11,762 2012 2011 $10,497 Total revenues . Cost of sales and related buying and occupancy costs Selling, general and administrative expenses 386 ..12,148 390 380 10,877 Retail 9,700 Credit Earnings before interest and income taxes Interest expense, net .. Earnings before income taxes Income tax expense 7,432) (6,592) (5,897) (3,166) (2,807 (2,412) (273) 1,118 (229) 1,345
Step by Step Solution
There are 3 Steps involved in it

Get step-by-step solutions from verified subject matter experts