

Question: Please help me answer (analyze) these two following questions based on the graphs listed down. Q.1 Whats the trend of the teams product unit cost
Please help me answer (analyze) these two following questions based on the graphs listed down.
Q.1
Whats the trend of the teams product unit cost by materials (assuming the building is 100% for production)? Discuss the underlying factors of the observed trend.
Q.2
Whats the trend of the teams net margin? Discuss the underlying factors of the observed trend.
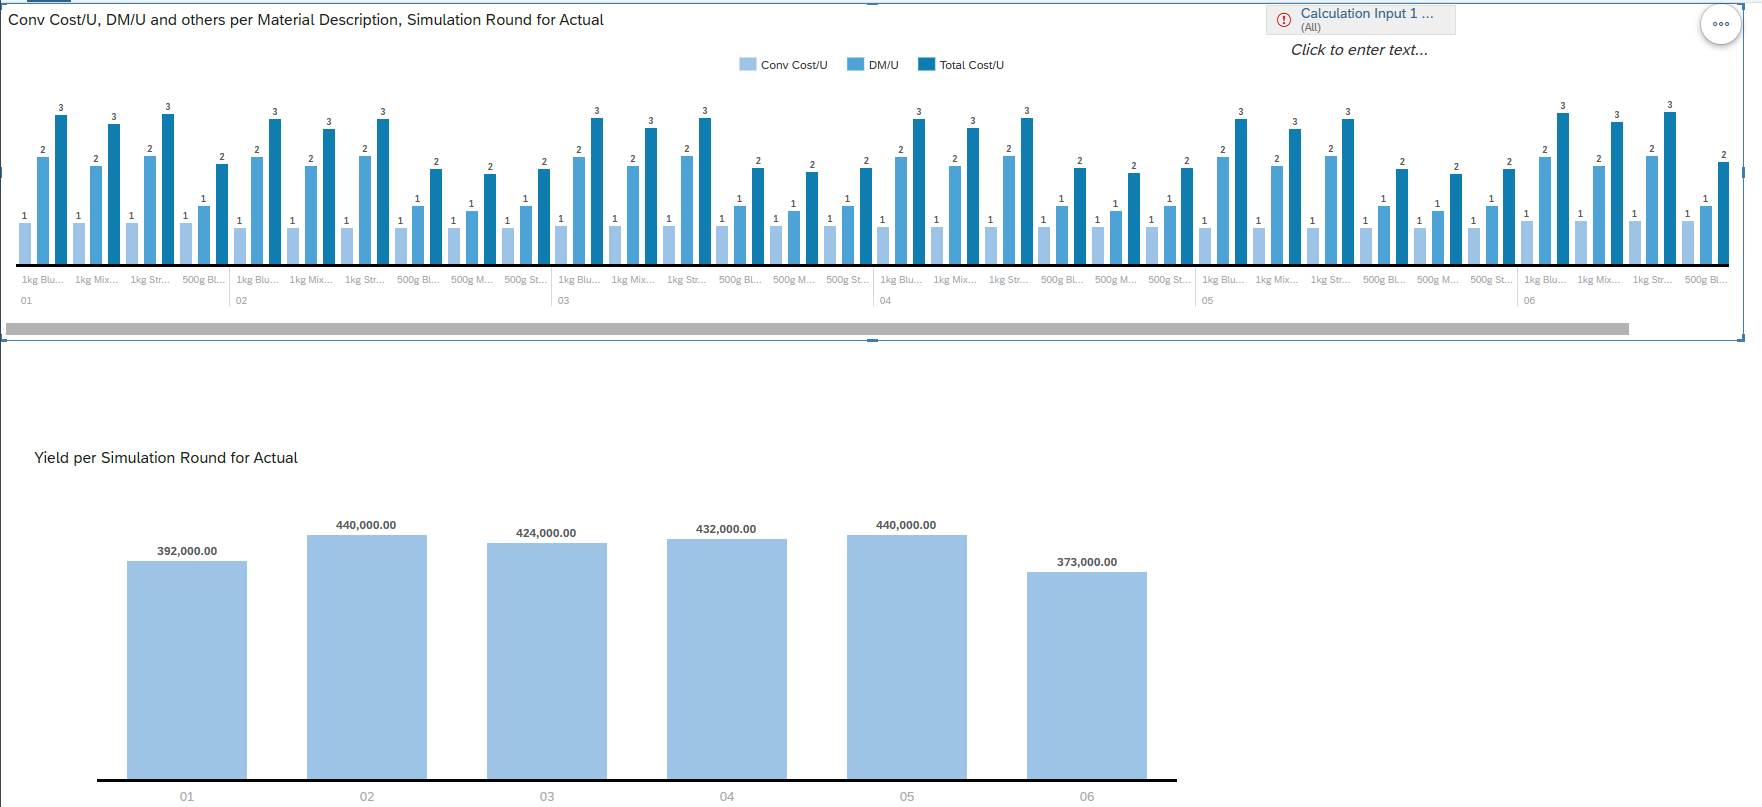
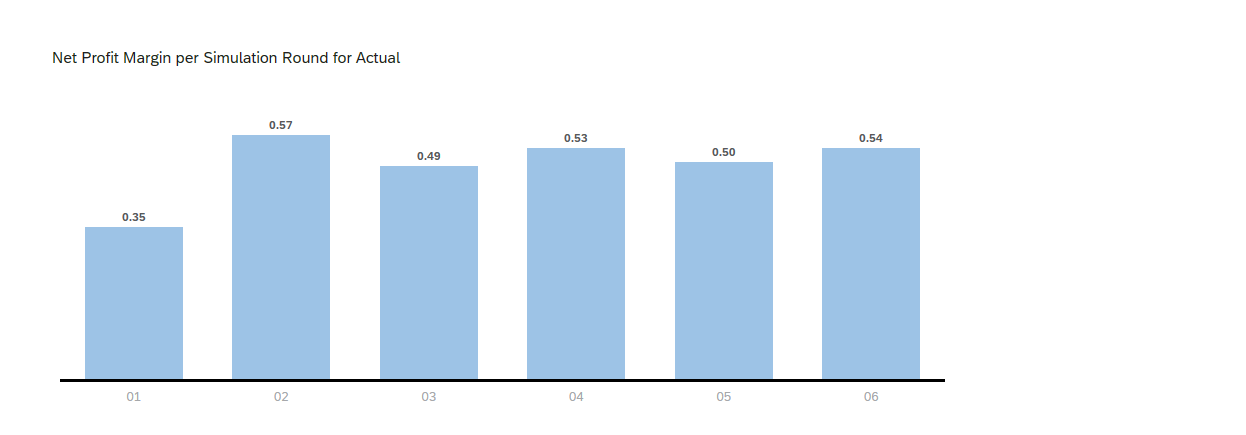
note: costs involved are conversion cost, total cost, and direct material per unit
Conv Cost/U, DM/U and others per Material Description, Simulation Round for Actual Yield per Simulation Round for Actual Net Profit Margin per Simulation Round for Actual
Step by Step Solution
There are 3 Steps involved in it
1 Expert Approved Answer
Step: 1 Unlock

Question Has Been Solved by an Expert!
Get step-by-step solutions from verified subject matter experts
Step: 2 Unlock
Step: 3 Unlock