

Question: Please help me answer my problems 1. The school store did a study comparing the cost of a sweatshirt with the number of sweatshirts sold.
Please help me answer my problems
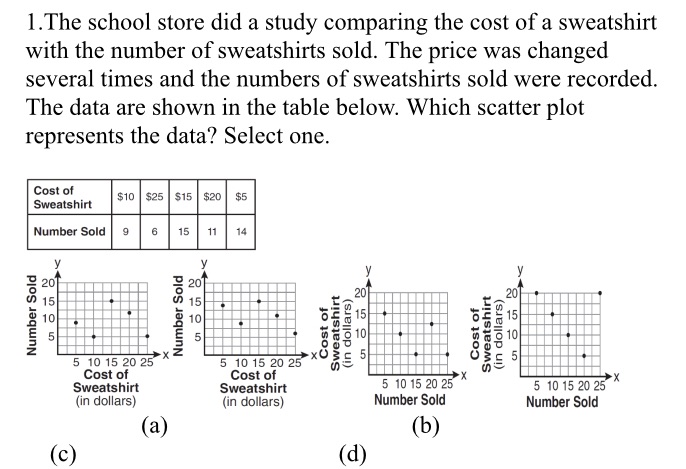
1. The school store did a study comparing the cost of a sweatshirt with the number of sweatshirts sold. The price was changed several times and the numbers of sweatshirts sold were recorded. The data are shown in the table below. Which scatter plot represents the data? Select one. Cost of Sweatshirt $10 $25 $15 $20 $5 Number Sold 9 6 15 11 14 Number Sold 20 Number Sold 20 15 Sweatshirt (in dollars) Sweatshirt (in dollars) 20 10 10 5 10 15 20 25 X 5 10 15 20 25 Cost of x Cost of Cost of Sweatshirt Cost of Sweatshirt 5 10 15 20 25 X 5 10 15 20 25 X (in dollars) (in dollars) Number Sold Number Sold (a) (b) (c) (d)
Step by Step Solution
There are 3 Steps involved in it

Get step-by-step solutions from verified subject matter experts