Question: Please help me answer the 3 questions!! I will rate if correct! thank you! VILLAGE BEDS Realigning Sales Territories ee Flicker was the newly hired
Please help me answer the 3 questions!! I will rate if correct! thank you!

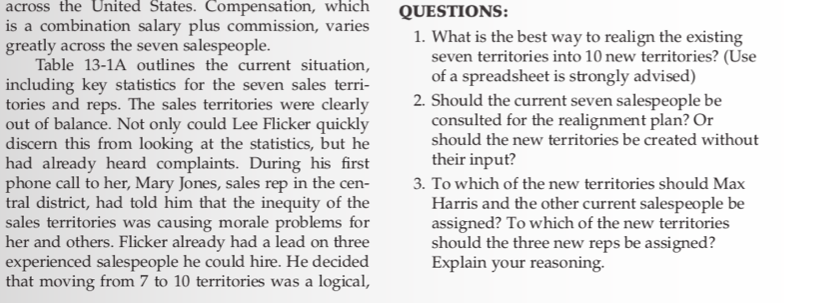
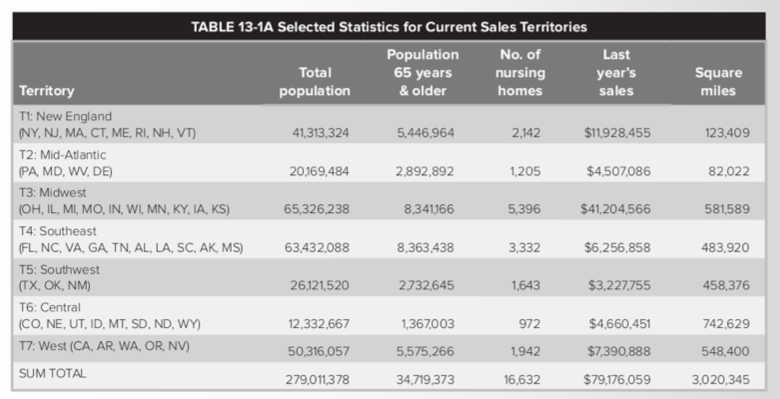
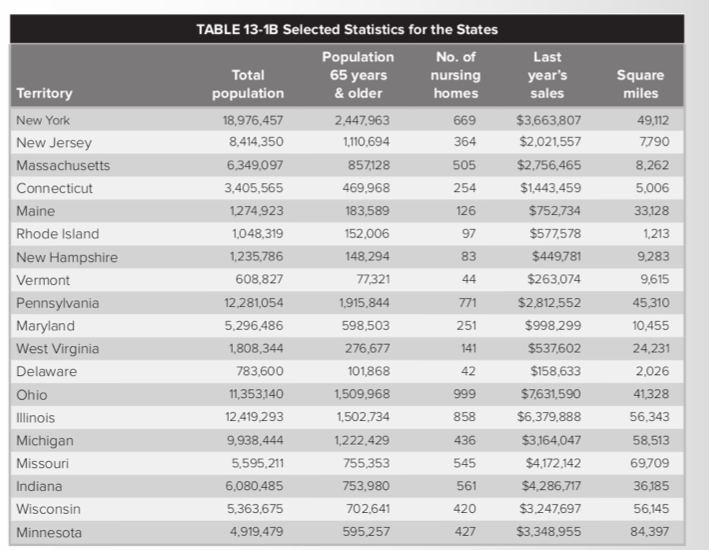
VILLAGE BEDS Realigning Sales Territories ee Flicker was the newly hired national sales manager for Village Beds. It was his first day J on the job and he was a bit overwhelmed by all he had to do. One significant problem, however, jumped out at him as a high priority: His new com- pany's sales territories were seriously out of balance and realignment was long overdue. A relatively small company in the health care equipment industry, Village Beds, manufactured a line of beds especially designed for nursing homes. Village Beds was started just 20 years ago in Toledo, Ohio, by its current president, Steve Moser. Before founding the company, Moser had been a nursing home administrator for more than 20 years. This gave him insight into the many problems that both patients and staff had with standard nursing home beds. He developed his new line of beds with these problems in mind. Although expensive, Village Beds have an excellent reputation in the industry for durability, quality, and value. Moser, however, was not an expert at design- ing a sales and marketing team. The initial sales territories were developed arbitrarily and were changed only by necessity as Village Beds grew and hired more salespeople. Currently, the com- pany has a sales force of just seven salespeople, who call directly on nursing home companies manageable first step. The problem was how to draw the boundary lines. Village Beds had always used states as control units, and he saw no reason not to continue doing that. Flicker was concerned about his salespeople's reaction to any realignment plan. Many of the sales- people had close ties to certain customers whom they would hate to leave behind. Also, it was inevi- table that he would reduce the territory size for some. He was especially worried about the reaction from Max Harris, who had sold Village Beds in the Midwest territory for over 15 years. The Midwest not only had potential that far exceeded any other territory, it was also the territory in which Village Beds was best known given its Ohio headquarters. Harris also happened to be a close personal friend of Steve Moser, the company president. Flicker had a spreadsheet file containing the various statistics for each state or control unit (see Table 13-1B). He sat down at his computer and began the task of realigning territories. He wanted to do it right. His goal was to create 10 territories that were as equal as possible with regard to sales potential and workload. In addition, he wanted to minimize the changes to the existing territories in order to keep the current seven salespeople happy. across the United States. Compensation, which is a combination salary plus commission, varies greatly across the seven salespeople. Table 13-1A outlines the current situation, including key statistics for the seven sales terri- tories and reps. The sales territories were clearly out of balance. Not only could Lee Flicker quickly discern this from looking at the statistics, but he had already heard complaints. During his first phone call to her, Mary Jones, sales rep in the cen- tral district, had told him that the inequity of the sales territories was causing morale problems for her and others. Flicker already had a lead on three experienced salespeople he could hire. He decided that moving from 7 to 10 territories was a logical, QUESTIONS: 1. What is the best way to realign the existing seven territories into 10 new territories? (Use of a spreadsheet is strongly advised) 2. Should the current seven salespeople be consulted for the realignment plan? Or should the new territories be created without their input? 3. To which of the new territories should Max Harris and the other current salespeople be assigned? To which of the new territories should the three new reps be assigned? Explain your reasoning. TABLE 13-1A Selected Statistics for Current Sales Territories Population No. of Total 65 years nursing population & older homes Last year's sales Square miles Territory 41,313,324 5,446.964 2,142 $11,928,455 123,409 20,169,484 2,892,892 1,205 $4,507,086 82,022 65,326,238 8,341,166 5,396 $41,204,566 581,589 T1: New England (NY, NJ, MA, CT, ME, RI, NH, VT) T2: Mid-Atlantic PA MD, WV, DE) T3: Midwest (OH, IL, MI, MO, IN, WI, MN, KY, IA, KS) T4: Southeast (FL, NC, VA, GA, TN, AL, LA, SC, AK, MS) T5: Southwest (TX, OK, NM) T6: Central (CO, NE, UT, ID, MT, SD, ND, WY) 17: West (CA, AR, WA, OR, NV) 63,432,088 8,363,438 3,332 $6,256,858 483,920 26,121,520 2,732,645 1,643 $3,227,755 458,376 972 742.629 12.332,667 50,316,057 279,011,378 1,367,003 5,575,266 34.719,373 $4,660,451 $7,390,888 $79,176,059 1,942 16,632 548,400 SUM TOTAL 3.020,345 TABLE 13-1B Selected Statistics for the States Population 65 years & older Total population No. of nursing homes Last year's sales Square miles Territory 669 364 505 254 126 97 New York New Jersey Massachusetts Connecticut Maine Rhode Island New Hampshire Vermont Pennsylvania Maryland West Virginia Delaware Ohio 83 44 18,976,457 8,414,350 6,349,097 3,405,565 1,274,923 1,049,319 1,235,736 603,827 12,281,054 5,296,486 1.3O8,344 783,600 11,353140 12,419,293 9,938,444 5,595,21 6,030,485 5,363,675 4,919,479 2,447,963 1,11O,694 857128 459,968 183,589 152,0O6 143,294 77327 1,915,844 598,503 276,677 101,868 1,509,968 1,502,734 1,222,429 755,353 753,980 702,641 595,257 25 $3.663.807 $2,021.557 $2,756,465 $1,443,459 $752,734 $577578 $449,781 $263,074 $2,812,552 $998,299 $37,602 $158,633 $7,631,590 6,379,888 $3,164,047 $4,172,142 $4,286,77 $3,247,697 3,348,955 49,112 7790 8,262 5,0O6 33,128 1,213 9283 9,615 45,310 10,455 24,231 2,026 41,328 56,343 5,53 69709 36,185 56,145 34,397 141 Illinois Michigan Missouri Indiana Wisconsin Minnesota 999 358 436 545 561 420 427 TABLE 13-1B Selected Statistics for the States No. of nursing homes Last year's sales Square miles Territory 304 466 380 728 413 289 364 349 228 332 179 250 200 Total population 4,041,769 2,926,324 2,688,418 15.982,378 8.049,313 7,078,515 8,186,453 5,689,283 4,447,100 4,468,976 4,012,012 2,673,400 2,844,658 20,851,820 3,450,654 1,819,046 4,301,261 1,711,263 2,233,169 1,293,953 902,195 754.844 642,200 493,782 33,871,648 5,130,632 5,894,121 3,421,399 1,998,257 279,011,378 Kentucky lowa Kansas Florida North Carolina Virginia Georgia Tennessee Alabama Louisiana South Carolina Arkansas Mississippi Texas Oklahoma New Mexico Colorado Nebraska Utah Idaho Montana South Dakota North Dakota Wyoming California Arizona Washington Oregon Nevada SUM TOTAL Population 65 years & older 505.221 436,022 357,560 2.812.899 965,918 792,794 785,899 705,471 578,123 518,401 485,453 374,276 344,204 2,064,330 455,486 212,828 417,222 232,732 189,819 146,217 120,894 107,943 94.403 57772 3,590,395 666.982 660,142 437,939 219,808 34,719,373 1,179 383 $2.422.933 $3,603,715 $2,946,882 $1,319,299 $783,635 $527,526 $724,878 $631,836 $449,421 $618,187 $327,695 $489,341 $385,039 $2,313,575 $759,958 $154,222 $1,107,862 $1,100,870 $416,221 $394,800 $500,924 $559,037 $405,000 $175,737 $5,131,090 $507,877 $1,060,689 $522,767 $168,464 $79,176,059 40.411 56,276 82,282 58,681 52,672 40,598 58,390 42,146 51718 47,720 31,117 53,183 47,695 266,874 69,903 121,599 104,100 77,359 84,905 83,574 147,047 77122 70,704 97.818 158,648 114,007 68.126 97,052 110,567 3,020,345 81 223 232 92 103 112 87 39 1,344 139 268 145 46 16,632


