Question: Please help me answer the attached two questions in excel. Final Prob1.) Our book defines a random variable (RV) as: A random variable is the
Please help me answer the attached two questions in excel.
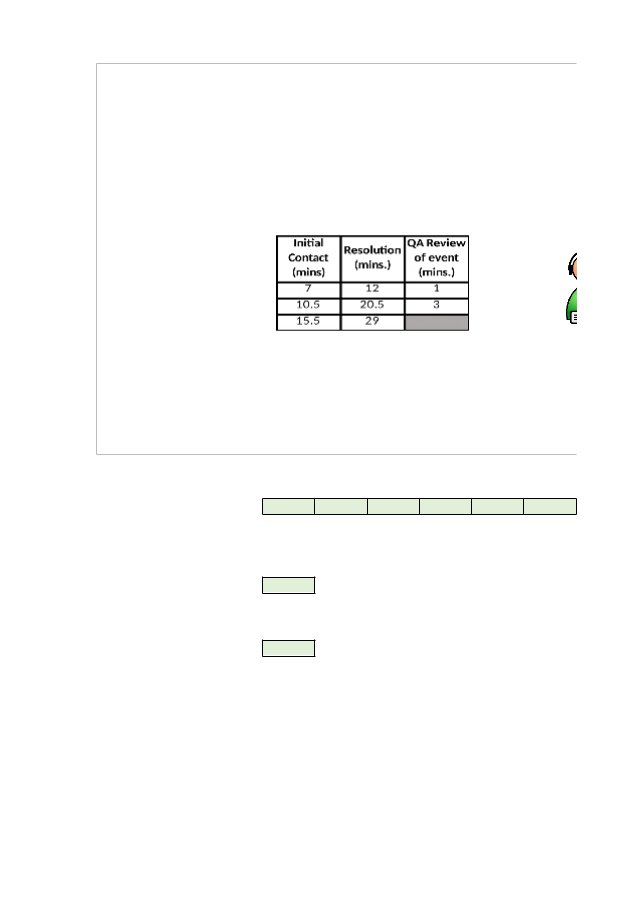
Final Prob1.) Our book defines a random variable (RV) as: A random variable is the numerical description of the o of an experiment. Formally, a random variable is a function that assigns a real number to each element of the sam (Evans, p. 140). With this in mind, consider a query to a help desk that always triggers 3 related activities--1) initi phone discussion occurs regarding the nature of the problem, 2) a solution is generated to the problem by referr problem to a specific subject matter expert (an SME), and 3) a review of the help query for quality assurance pur There are 3 equally probable types of problem calls, 3 equally probable types of solutions, and 2 equally probabl of reviews. They can be measured in terms of minutes that are consumed in the 3 parts of the process. Also, 1), 3) above are independent events. Each of the possible values are shown below (obviously, this is a simplification and many values would likely be possible). A RV is calculated that is the sum (time) of these 3 independent outcomes. 1) List the values of the RV in the row provided below. 2) Provide the probabilities of the RVs, as well as the expected value and the standard deviation. 1) RV Sample Space=== 2) Expected Value== Std. Dev.== merical description of the outcome to each element of the sample set. related activities--1) initially a d to the problem by referring the for quality assurance purposes. ns, and 2 equally probable types s of the process. Also, 1), 2) and sly, this is a simplification of reality deviation. Final Prob2.) Consider the 12 sample observations in the table below. The sample data represents the opening of vari monthly period. Each transaction records the account type, gender of the individual opening the account, the level of invested; for example, observation 4 opened an IRA, is female, has a college education, and invested 5000. Create a p education in the rows area, gender in the filter area, and investment in the values area. If we consider this sample to openings in the month, we can make statements that relate to marginal and conditional probabilities. For example, w CDs in our data, what is the probability of being College Educated?" This is equivalent to finding the P( Col|Female an 1) Manipulate the Value Field Settings of the pivot table and use the pull down menus for filtering rows, columns, and probability of P( HS|Female and CD ). Sample Observations obs 1 2 3 4 5 6 7 8 9 10 11 12 account CD MM IRA IRA MM CD CD IRA MM IRA CD CD gender M F F F M F F M F F M F education investment HS 12000 COL 2000 HS 6000 COL 5000 COL 1500 HS 15000 HS 24000 HS 5000 COL 1200 COL 4500 COL 14000 COL 22000 1) e sample data represents the opening of various accounts at a large American bank during a e individual opening the account, the level of education of the individual, and the amount ege education, and invested 5000. Create a pivot table with account in the columns area, he values area. If we consider this sample to be indicative of the population of all account and conditional probabilities. For example, we can ask-- "Amongst Females that invested in is equivalent to finding the P( Col|Female and CD ). down menus for filtering rows, columns, and filter areas to provide the conditional


