

Question: Please help me answer the following: Question 1 Suppose our target population is very large, and the following histogram shows the distribution of net effectiveness


Please help me answer the following:
![C] Between 4814.945 and 4585.128 C] Between 13 99.993 and 1399.928 C]](https://s3.amazonaws.com/si.experts.images/answers/2024/06/667c7accd8bcf_932667c7accc6dd3.jpg)
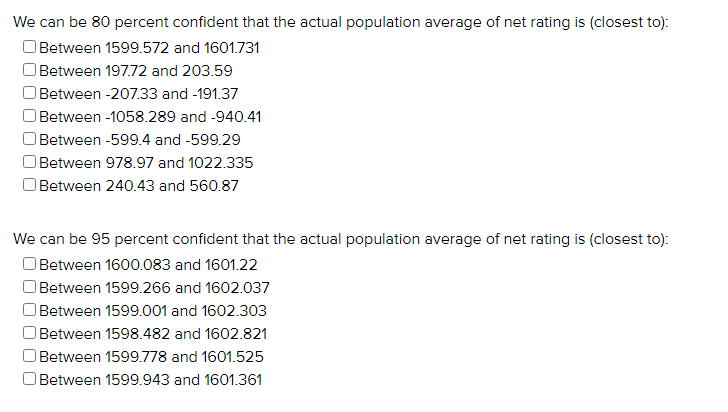
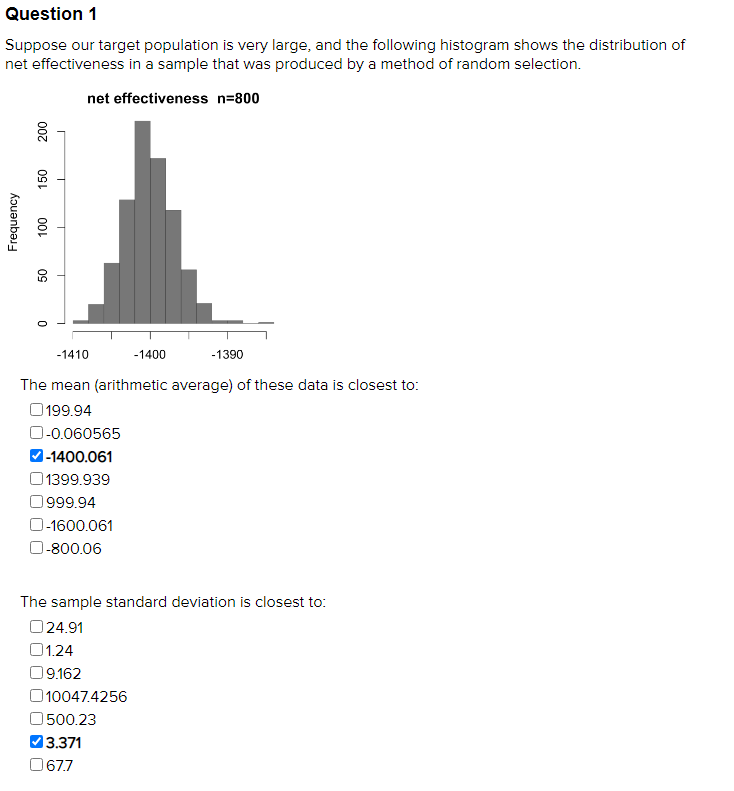
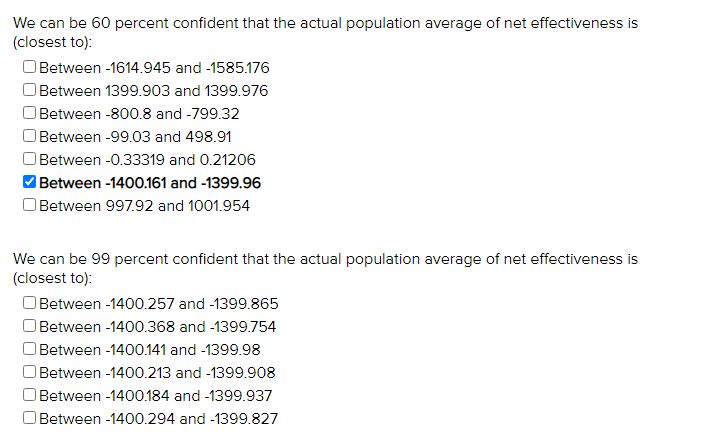
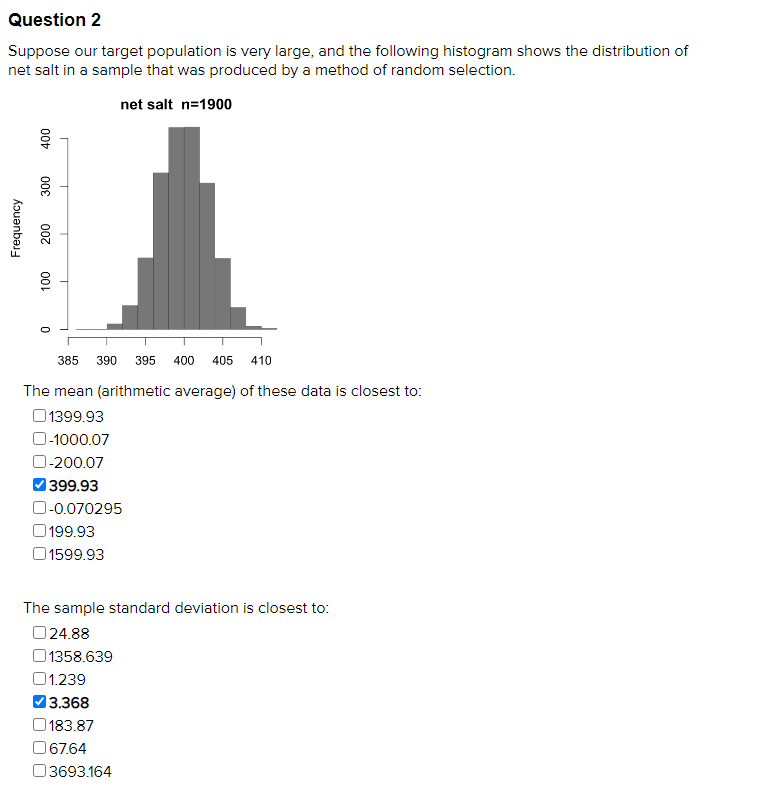
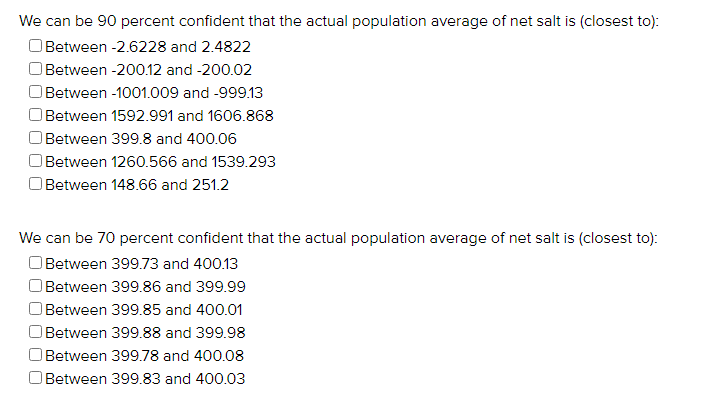
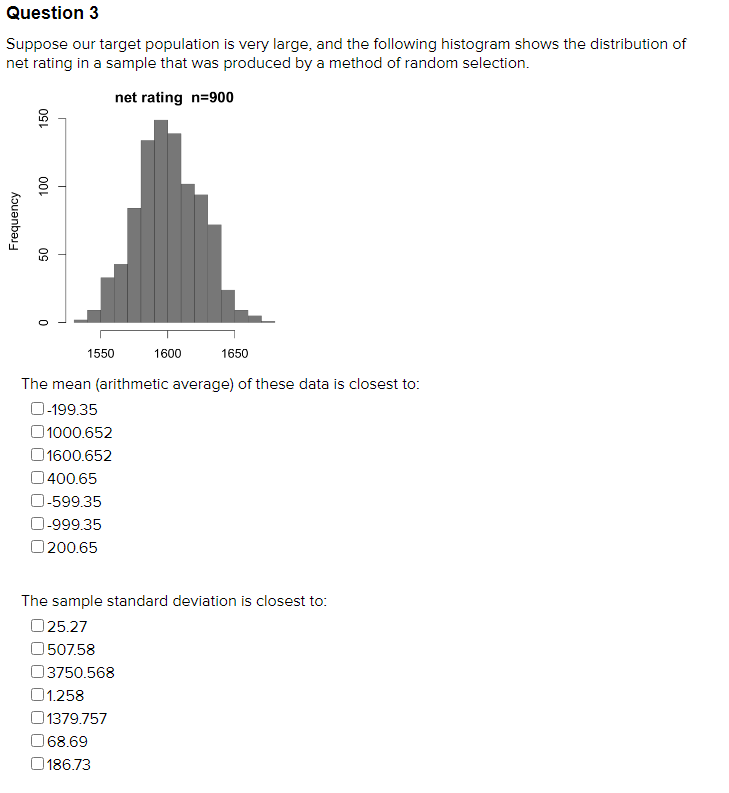
Question 1 Suppose our target population is very large, and the following histogram shows the distribution of net effectiveness in a sample that was produced by a method of random selection. net effectiveness n=800 200 150 Frequency 100 -1410 -1400 -1390 The mean (arithmetic average) of these data is closest to: 199.94 0-0.060565 -1400.061 01399.939 0999.94 0-1600.061 0-800.06 The sample standard deviation is closest to: 024.91 01.24 09.162 010047.4256 0500.23 3.371 0 67.7We can be 89 percent condent that the actual population average of net effectiveness is [closest to}: C] Between 4814.945 and 4585.128 C] Between 13 99.993 and 1399.928 C] Between 899.8 and $99.32 C] Between -99.93 and 498.91 C] Between 933319 and 9.21298 Between 4499.191 and 4399.96 C] Between 99192 and 1991.954 We can be 99 percent condent that the actual population average of net effectiveness is [closest to}: C] Between 4499.25? and 4399.885 [:1 Between 4499.388 and 4399.254 C] Between 4499.141 and 4399.98 C] Between 4499.213 and 4399.998 C] Between 4499.184 and 4399.93?!r C] Between 4499.294 and 4399.82? Question 2 Suppose our target population is very large, and the following histogram shows the distribution of net salt in a sample that was produced by a method of random selection. net salt n=1900 400 300 Frequency 200 100 O 385 390 395 400 405 410 The mean (arithmetic average) of these data is closest to: 01399.93 0-1000.07 0-200.07 399.93 0-0.070295 0199.93 01599.93 The sample standard deviation is closest to: 024.88 01358.639 01.239 3.368 0183.87 0 67.64 03693.164We can be 00 percent condent that the actual population average of net salt is [closest to}: C] Between 2.0228 and 2.4822 C] Between 200.12 and 200.02 C] Between 1001.000 and 000.13 C] Between 1502.001 and 1000.808 C] Between 300.8 and 400.00 [:1 Between 1200.500 and 1530.203 C] Between 148.00 and 251.2 We can be 20 percent condent that the actual population average of net salt 'Is {closest to}: C] Between 300.23 and 400.13 C] Between 300.80 and 300.00 C] Between 300.85 and 400.01 C] Between 300.88 and 300.08 C] Between 300.28 and 400.08 [:1 Between 300.83 and 400.03 Question 3 Suppose our target population is very large, and the following histogram shows the distribution of net rating in a sample that was produced by a method of random selection. net rating n=900 150 Frequency 1550 1600 1650 The mean (arithmetic average) of these data is closest to: 0-199.35 01000.652 01600.652 0400.65 0-599.35 0-999.35 O200.65 The sample standard deviation is closest to: 025.27 0 507.58 0 3750.568 01.258 01379.757 0 68.69 0186.73We can be 80 percent confident that the actual population average of net rating is (closest to): Between 1599.572 and 1601.731 Between 197.72 and 203.59 Between -207.33 and -191.37 U Between -1058.289 and -940.41 Between -599.4 and -599.29 U Between 978.97 and 1022.335 Between 240.43 and 560.87 We can be 95 percent confident that the actual population average of net rating is (closest to): Between 1600.083 and 1601.22 Between 1599.266 and 1602.037 U Between 1599.001 and 1602.303 Between 1598.482 and 1602.821 U Between 1599.778 and 1601.525 Between 1599.943 and 1601.361
Step by Step Solution
There are 3 Steps involved in it

Get step-by-step solutions from verified subject matter experts