

Question: Please help me answer the highlighted boxes. All relevant info is included 46 8 Cash Budget 47 48 Assume actual cash receipts and disbursements will
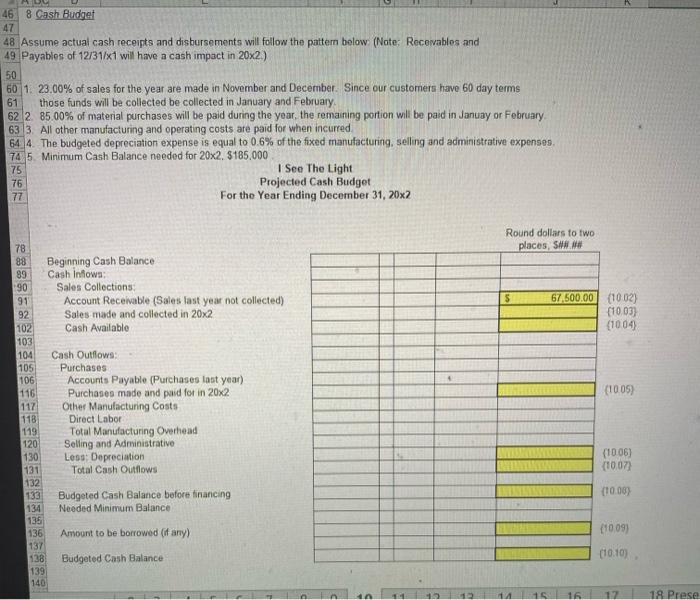

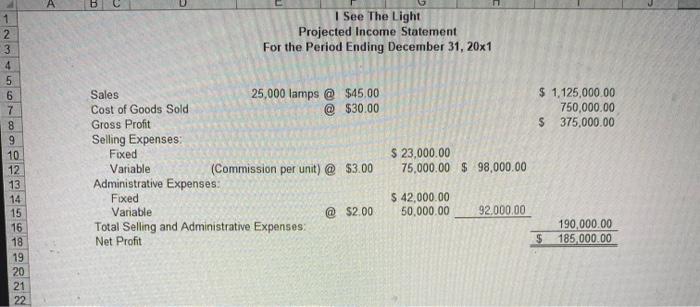
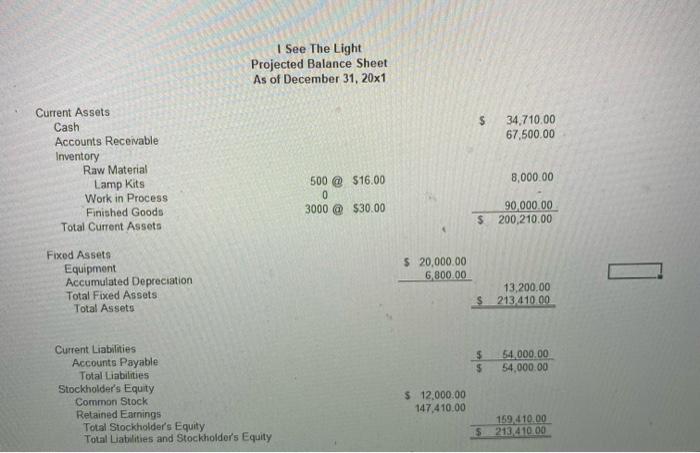
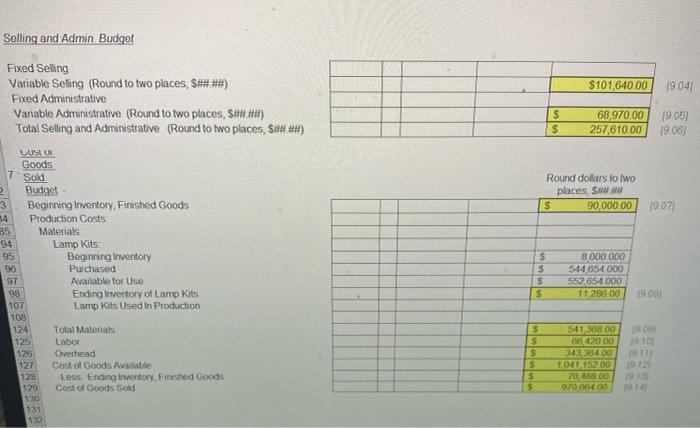
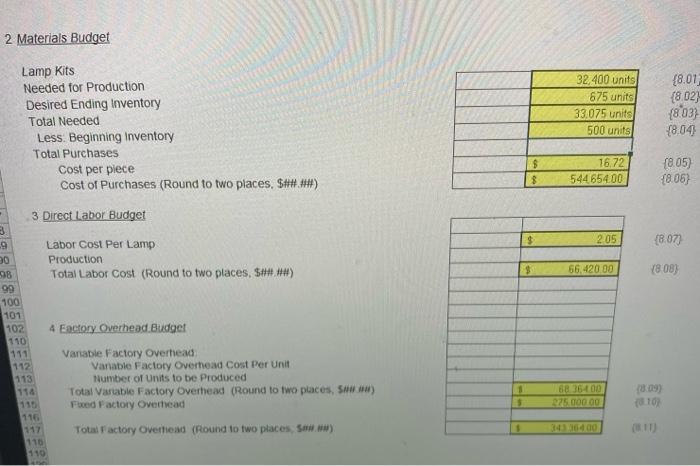
46 8 Cash Budget 47 48 Assume actual cash receipts and disbursements will follow the pattern below. (Note: Receivables and 49 Payables of 12/31/x1 will have a cash impact in 20x2.) 50 601. 23.00% of sales for the year are made in November and December. Since our customers have 60 day terms 61 those funds will be collected be collected in January and February 622 85.00% of material purchases will be paid during the year, the remaining portion will be paid in Januay or February 633. All other manufacturing and operating costs are paid for when incurred 64. 4 The budgeted depreciation expense is equal to 0.6% of the fixed manufacturing, selling and administrative expenses. 74 5. Minimum Cash Balance needed for 20x2. $185,000 75 I See The Light 76 Projected Cash Budget 77 For the Year Ending December 31, 20x2 Round dollars to two places, S. Beginning Cash Balance Cash Inflows: Sales Collections Account Receivable (Sales last year not collected) Sales made and collected in 20x2 Cash Available 67.500,00 (1002) (1003) 1004 (1005) 78 88 89 90 91 92 102 103 104 105 106 116 117 118 119 120 130 131 132 133 134 135 136 137 138 139 140 Cash Outflows: Purchases Accounts Payable (Purchases last year) Purchases made and paid for in 20x2 Other Manufacturing Costs Direct Labor Total Manufacturing Overhead Selling and Administrative Less: Depreciation Total Cash Outflows (1006) (1007) (1000) Budgeted Cash Balance before financing Needed Minimum Balance Amount to be borrowed (if any) (1009) Budgeted Cash Balance (10.10) 14 17 18. Prese Production Budget Planned Sales Desired Ending Inventory of Finished Goods Total Needed Less: Beginning Inventory 33000 2400 35400 Total Production 32,400 units 17.01) | See The Light Projected Income Statement For the Period Ending December 31, 20x1 $ 1.125,000.00 750,000.00 $ 375,000.00 1 2 3 4 5 6 7 8 9 10 12 13 14 15 16 18 19 20 21 22 Sales 25,000 lamps @ $45.00 Cost of Goods Sold @ $30.00 Gross Profit Selling Expenses Fixed Variable (Commission per unit) $3.00 Administrative Expenses: Fixed Variable @ $2.00 Total Selling and Administrative Expenses: Net Profit $ 23,000.00 75,000.00 $ 98,000.00 $ 42,000.00 50,000.00 92.000.00 190,000.00 185,000.00 $ I See The Light Projected Balance Sheet As of December 31, 20x1 34 710,00 67,500.00 Current Assets Cash Accounts Receivable Inventory Raw Material Lamp Kits Work in Process Finished Goods Total Current Assets 8,000.00 500 @ $16.00 0 3000 @ $30.00 90,000.00 200,210.00 $ $ 20,000.00 G 800.00 Fixed Assets Equipment Accumulated Depreciation Total Fixed Assets Total Assets 13,200.00 213 410.00 $ $ 54.000,00 54,000.00 Current Liabilities Accounts Payable Total Liabilities Stockholder's Equity Common Stock Retained Earnings Total Stockholder's Equity Total Liabilities and Stockholder's Equity $ 12,000.00 147.410.00 159.410.00 5213 410.00 Selling and Admin Budget $101,640.00 19.047 Fixed Seling Variable Seling (Round to two places, $## ##) Fixed Administrative Variable Administrative (Round to two places, St#.##) Total Selling and Administrative (Round to two places, $4.44) LOS Goods $ $ 68,970.00 257,610.00 1905) 19.06) 7 Sold Round dollars folwo places, SW S 90,000.00 19:07 Budget 3 Beginning Inventory, Finished Goods 34 Production Costs 35 Materials 94 Lamp Kits 95 Beginning inventory 96 Purchased 97 Available for Use 98 Ending inventory of Lamp Kits 107 Lamp Kits Used In Production 108 124 Total Matenats 125 Labor 126 Overhead 127 Cost of Goods Available 128 Less Ending Inventory, Fined Goods 120 Cost of Goods Sold 5 S $ s 8.000.000 544,654.000 552,654 000 11,288.00 1908 $ S 5 $ 5 5 541308 00 664420.00 343 384.00 1,061, 15200 70-4000 ROS 1910 12.11 19.12 2 Materials Budget 32.400 units 675 units 33.075 units 500 units {8.01 (8.02) {803) {8.04 Lamp Kits Needed for Production Desired Ending Inventory Total Needed Less: Beginning inventory Total Purchases Cost per piece Cost of Purchases (Round to two places, S####) 3 Direct Labor Budget $ 8 16.72 544654.00 (805) (8.06) $ 205 {8077 Labor Cost Per Lamp Production Total Labor Cost (Round to two places, $##### $ 56.42000 (808) 33 .9 30 98 99 100 101 102 110 111 112 113 4 Factory Overhead. Budget Vanable Factory Overhead Vanable Factory Overhead Cost Per Unit Number of Units to be produced Total Variable Factory Overhead (Round to two places, saww) Food Factory Overhead Total Factory Overioad (Round to two places, Sew) 68 36400 175.000.00 (3.09) (107 $ 1 110 110 46 8 Cash Budget 47 48 Assume actual cash receipts and disbursements will follow the pattern below. (Note: Receivables and 49 Payables of 12/31/x1 will have a cash impact in 20x2.) 50 601. 23.00% of sales for the year are made in November and December. Since our customers have 60 day terms 61 those funds will be collected be collected in January and February 622 85.00% of material purchases will be paid during the year, the remaining portion will be paid in Januay or February 633. All other manufacturing and operating costs are paid for when incurred 64. 4 The budgeted depreciation expense is equal to 0.6% of the fixed manufacturing, selling and administrative expenses. 74 5. Minimum Cash Balance needed for 20x2. $185,000 75 I See The Light 76 Projected Cash Budget 77 For the Year Ending December 31, 20x2 Round dollars to two places, S. Beginning Cash Balance Cash Inflows: Sales Collections Account Receivable (Sales last year not collected) Sales made and collected in 20x2 Cash Available 67.500,00 (1002) (1003) 1004 (1005) 78 88 89 90 91 92 102 103 104 105 106 116 117 118 119 120 130 131 132 133 134 135 136 137 138 139 140 Cash Outflows: Purchases Accounts Payable (Purchases last year) Purchases made and paid for in 20x2 Other Manufacturing Costs Direct Labor Total Manufacturing Overhead Selling and Administrative Less: Depreciation Total Cash Outflows (1006) (1007) (1000) Budgeted Cash Balance before financing Needed Minimum Balance Amount to be borrowed (if any) (1009) Budgeted Cash Balance (10.10) 14 17 18. Prese Production Budget Planned Sales Desired Ending Inventory of Finished Goods Total Needed Less: Beginning Inventory 33000 2400 35400 Total Production 32,400 units 17.01) | See The Light Projected Income Statement For the Period Ending December 31, 20x1 $ 1.125,000.00 750,000.00 $ 375,000.00 1 2 3 4 5 6 7 8 9 10 12 13 14 15 16 18 19 20 21 22 Sales 25,000 lamps @ $45.00 Cost of Goods Sold @ $30.00 Gross Profit Selling Expenses Fixed Variable (Commission per unit) $3.00 Administrative Expenses: Fixed Variable @ $2.00 Total Selling and Administrative Expenses: Net Profit $ 23,000.00 75,000.00 $ 98,000.00 $ 42,000.00 50,000.00 92.000.00 190,000.00 185,000.00 $ I See The Light Projected Balance Sheet As of December 31, 20x1 34 710,00 67,500.00 Current Assets Cash Accounts Receivable Inventory Raw Material Lamp Kits Work in Process Finished Goods Total Current Assets 8,000.00 500 @ $16.00 0 3000 @ $30.00 90,000.00 200,210.00 $ $ 20,000.00 G 800.00 Fixed Assets Equipment Accumulated Depreciation Total Fixed Assets Total Assets 13,200.00 213 410.00 $ $ 54.000,00 54,000.00 Current Liabilities Accounts Payable Total Liabilities Stockholder's Equity Common Stock Retained Earnings Total Stockholder's Equity Total Liabilities and Stockholder's Equity $ 12,000.00 147.410.00 159.410.00 5213 410.00 Selling and Admin Budget $101,640.00 19.047 Fixed Seling Variable Seling (Round to two places, $## ##) Fixed Administrative Variable Administrative (Round to two places, St#.##) Total Selling and Administrative (Round to two places, $4.44) LOS Goods $ $ 68,970.00 257,610.00 1905) 19.06) 7 Sold Round dollars folwo places, SW S 90,000.00 19:07 Budget 3 Beginning Inventory, Finished Goods 34 Production Costs 35 Materials 94 Lamp Kits 95 Beginning inventory 96 Purchased 97 Available for Use 98 Ending inventory of Lamp Kits 107 Lamp Kits Used In Production 108 124 Total Matenats 125 Labor 126 Overhead 127 Cost of Goods Available 128 Less Ending Inventory, Fined Goods 120 Cost of Goods Sold 5 S $ s 8.000.000 544,654.000 552,654 000 11,288.00 1908 $ S 5 $ 5 5 541308 00 664420.00 343 384.00 1,061, 15200 70-4000 ROS 1910 12.11 19.12 2 Materials Budget 32.400 units 675 units 33.075 units 500 units {8.01 (8.02) {803) {8.04 Lamp Kits Needed for Production Desired Ending Inventory Total Needed Less: Beginning inventory Total Purchases Cost per piece Cost of Purchases (Round to two places, S####) 3 Direct Labor Budget $ 8 16.72 544654.00 (805) (8.06) $ 205 {8077 Labor Cost Per Lamp Production Total Labor Cost (Round to two places, $##### $ 56.42000 (808) 33 .9 30 98 99 100 101 102 110 111 112 113 4 Factory Overhead. Budget Vanable Factory Overhead Vanable Factory Overhead Cost Per Unit Number of Units to be produced Total Variable Factory Overhead (Round to two places, saww) Food Factory Overhead Total Factory Overioad (Round to two places, Sew) 68 36400 175.000.00 (3.09) (107 $ 1 110 110
Step by Step Solution
There are 3 Steps involved in it

Get step-by-step solutions from verified subject matter experts