

Question: Please help me answer these questions and plot the graph! Thank you! 4. The Capital Asset Pricing Model and the security market line Teresa holds
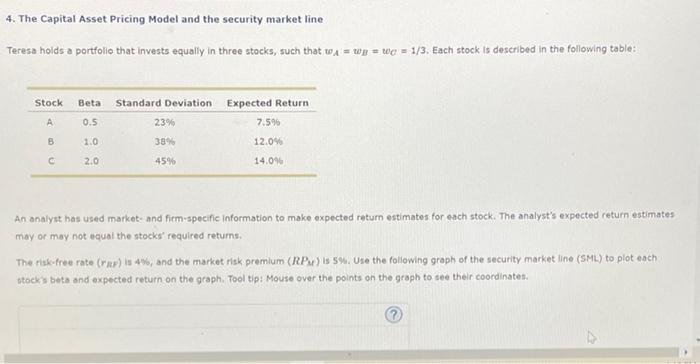
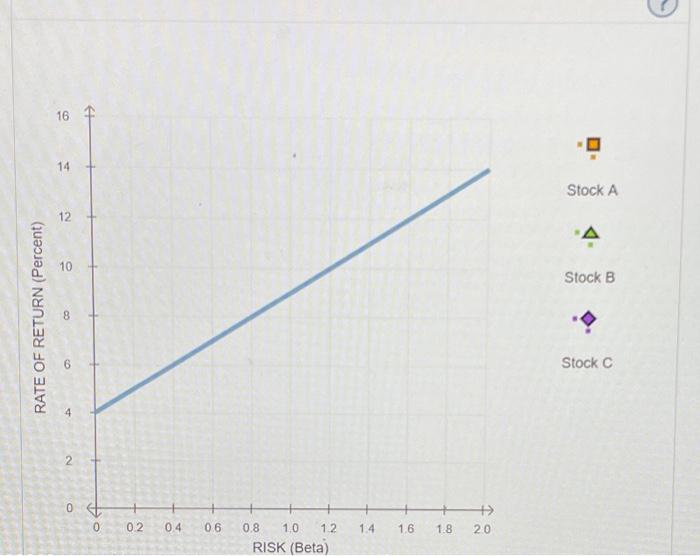
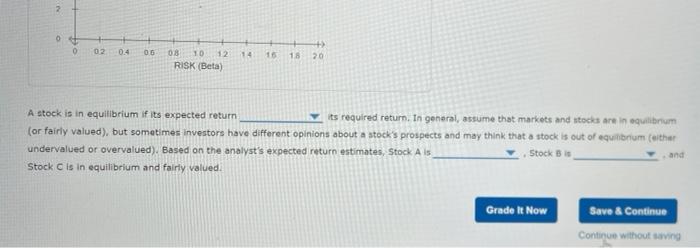
4. The Capital Asset Pricing Model and the security market line Teresa holds a portfolio that invests equally in three stocks, such that wx = we = wc = 1/3. Each stock is described in the following table: Stock Beta Standard deviation Expected Return 23% 7.5% A 0.5 8 1.0 389 12.09 20 45% 14.09 An analyst has used market and firm-specific information to make expected return estimates for each stock. The analyst's expected return estimates may or may not equal the stocks' required returns The risk-free rate (np) is 4*, and the market risk premium (RPM) is sw. Use the following graph of the security market line (SML) to plot each stock's bets and expected return on the graph. Tooltip: mouse over the points on the graph to see their coordinater: 16 6 14 Stock A 12 10 Stock B RATE OF RETURN (Percent) CO Stock C 4 2 0 + 20 0 02 0.4 0.6 1.4 1.6 1.8 0.8 1.0 12 RISK (Beta) 2 0 0 02 0.4 05 + 15 18 20 14 08 10 12 RISK (Beta) A stock is in equilibrium if its expected return its required return. In general, assume that markets and stocks are in equilibrium (or fairly valued), but sometimes investors have different opinions about a stock's prospects and may think that a stock is out or equilibrium (either undervalued or overvalued). Based on the analyst's expected return estimates, Stock Als Stock B Stock C is in equilibrium and fairly valued. and Grade It Now Save & Continue Continue without saving
Step by Step Solution
There are 3 Steps involved in it

Get step-by-step solutions from verified subject matter experts