

Question: Please help me answer this question. G ng.cengage.com C Mind Tap - Cengage Learning Please Help Me With This Question | Chegg.com Course Hero CENGAGE
Please help me answer this question.
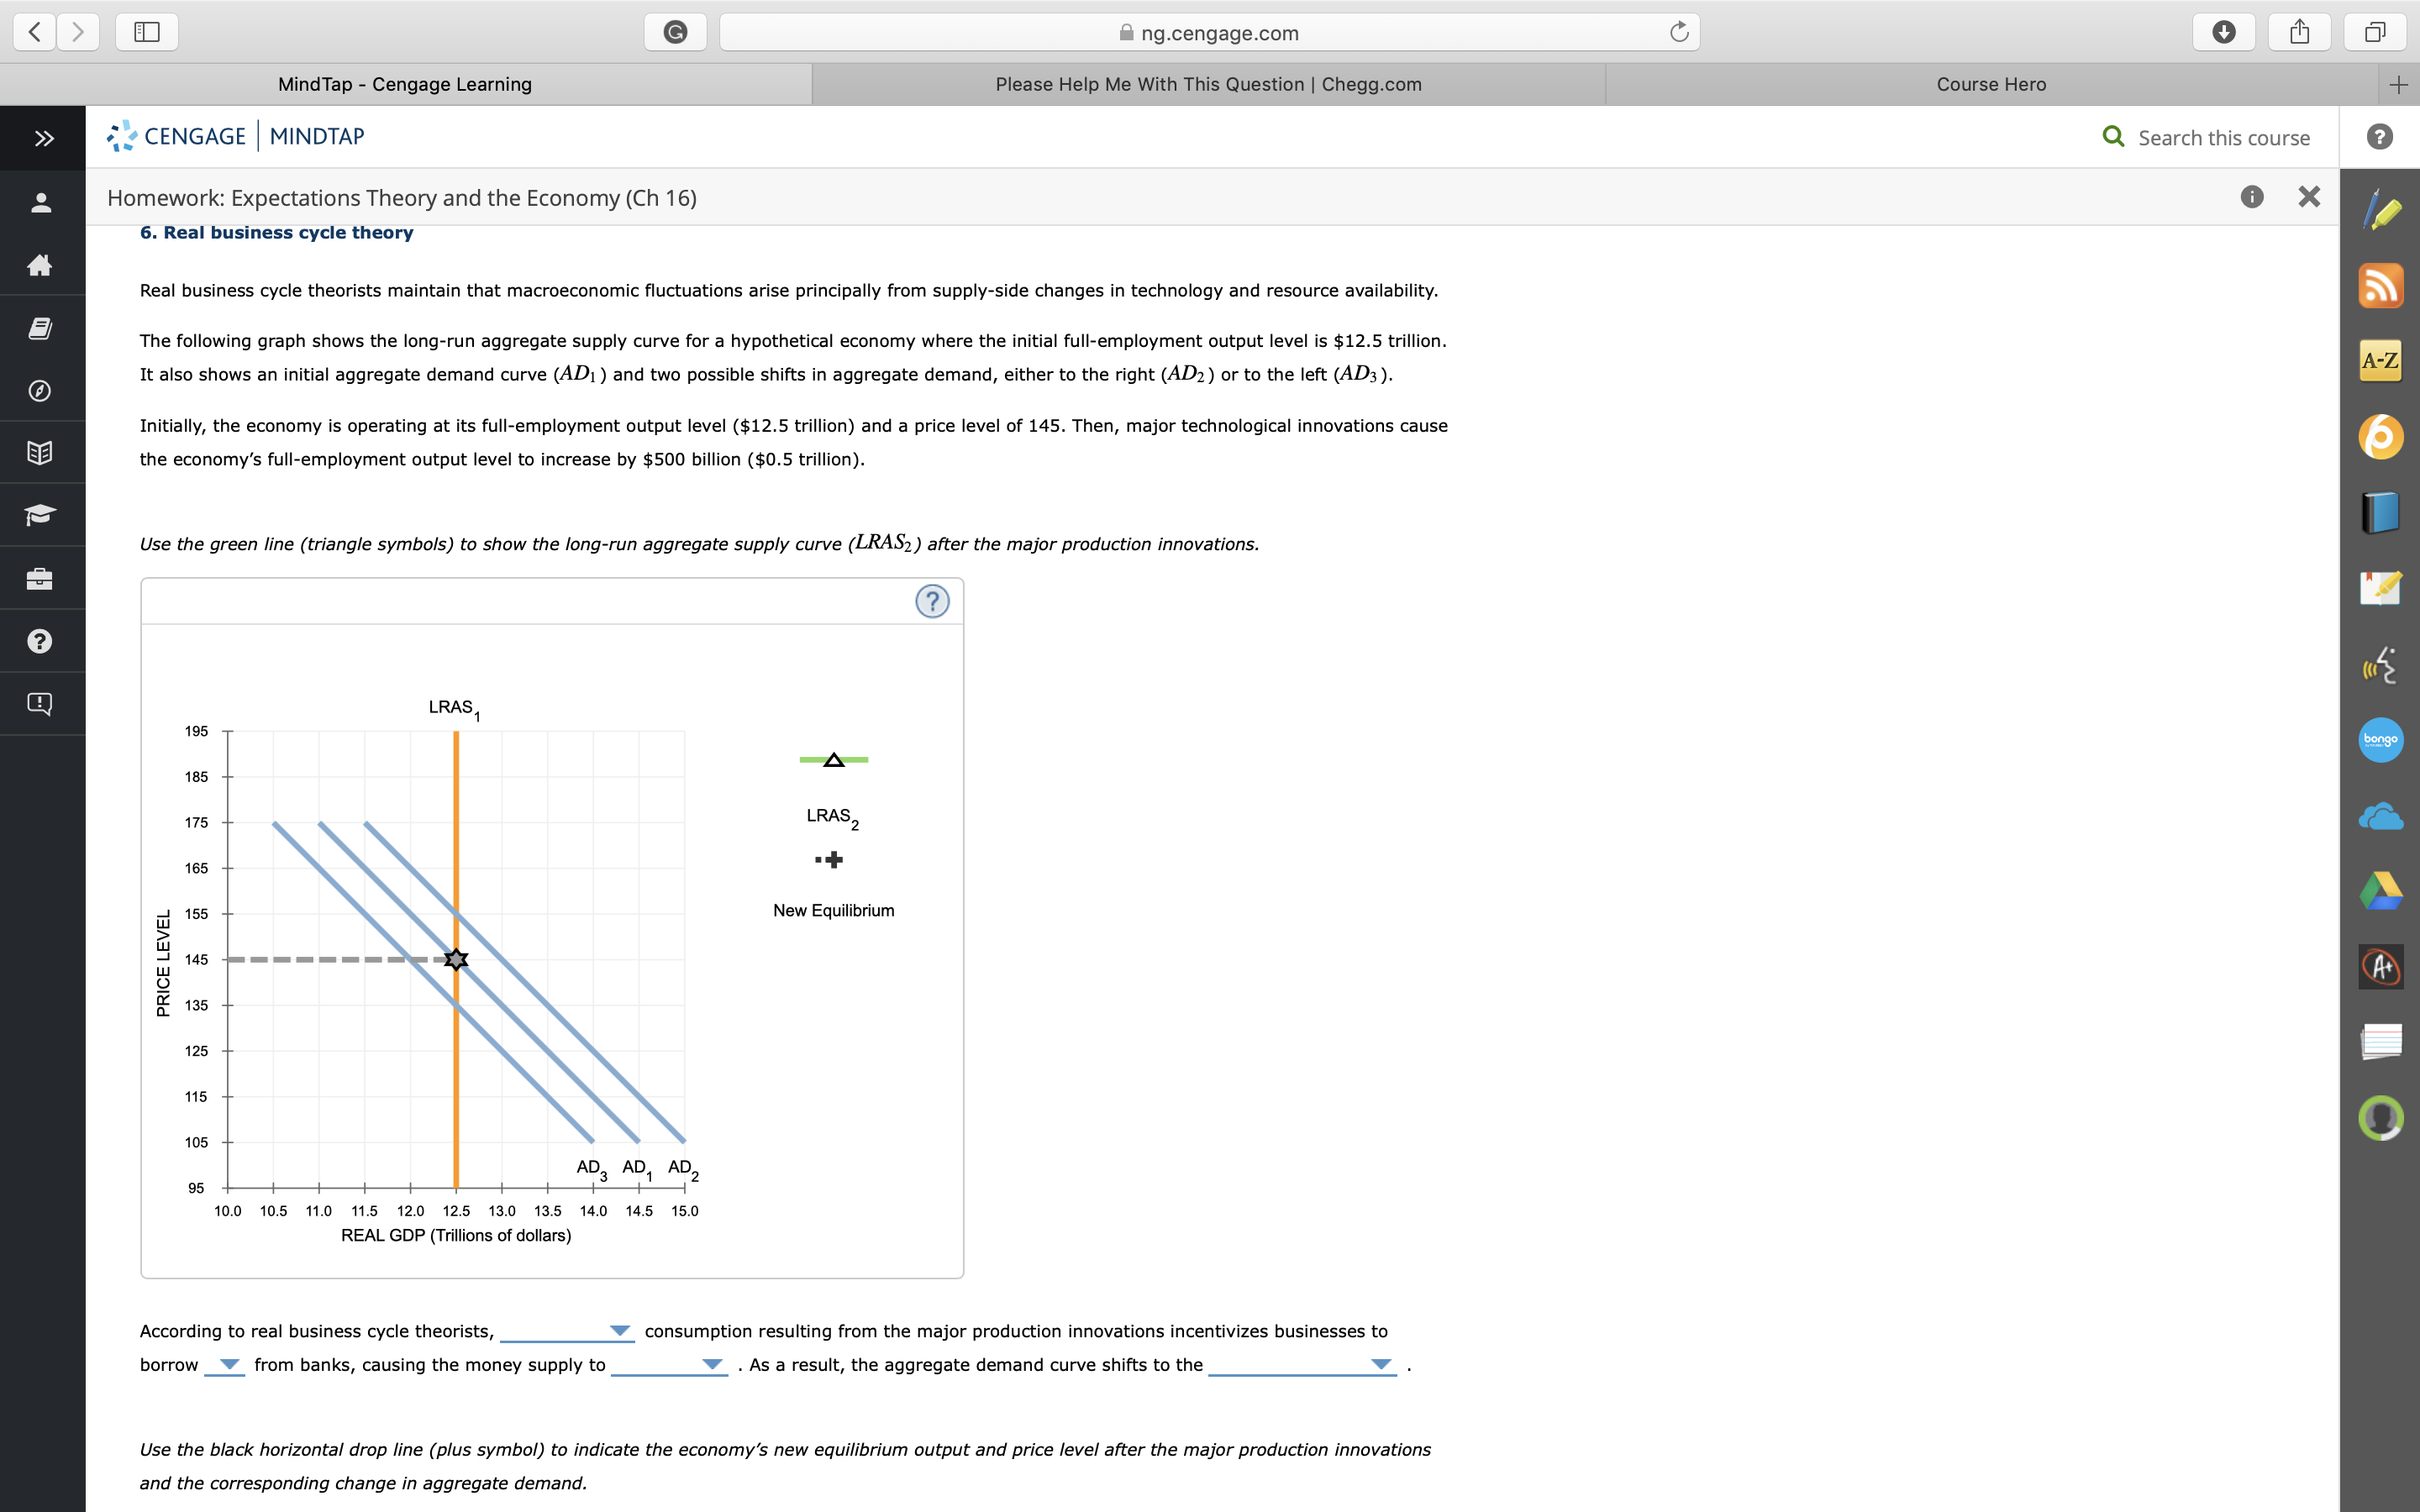
G ng.cengage.com C Mind Tap - Cengage Learning Please Help Me With This Question | Chegg.com Course Hero CENGAGE | MINDTAP Q Search this course ? Homework: Expectations Theory and the Economy (Ch 16) X 6. Real business cycle theory Real business cycle theorists maintain that macroeconomic fluctuations arise principally from supply-side changes in technology and resource availability. E The following graph shows the long-run aggregate supply curve for a hypothetical economy where the initial full-employment output level is $12.5 trillion. A-Z It also shows an initial aggregate demand curve (AD, ) and two possible shifts in aggregate demand, either to the right (AD2 ) or to the left (AD3 ). Initially, the economy is operating at its full-employment output level ($12.5 trillion) and a price level of 145. Then, major technological innovations cause the economy's full-employment output level to increase by $500 billion ($0.5 trillion). Use the green line (triangle symbols) to show the long-run aggregate supply curve (LRAS2) after the major production innovations. ? LRAS 195 bongo A 185 175 LRAS 2 165 155 New Equilibrium PRICE LEVEL 145 A+ 135 125 115 105 AD? AD AD 2 10.0 10.5 11.0 11.5 12.0 12.5 13.0 13.5 14.0 14.5 15.0 REAL GDP (Trillions of dollars) According to real business cycle theorists, consumption resulting from the major production innovations incentivizes businesses to borrow from banks, causing the money supply to . As a result, the aggregate demand curve shifts to the_ Use the black horizontal drop line (plus symbol) to indicate the economy's new equilibrium output and price level after the major production innovations and the corresponding change in aggregate demand
Step by Step Solution
There are 3 Steps involved in it

Get step-by-step solutions from verified subject matter experts