

Question: please help me answer this question , thanks !! Problem 2: Statistics in Decision Making: Simulation. Intergalactic Airlines (IA) is an airline company that operates
please help me answer this question , thanks !!
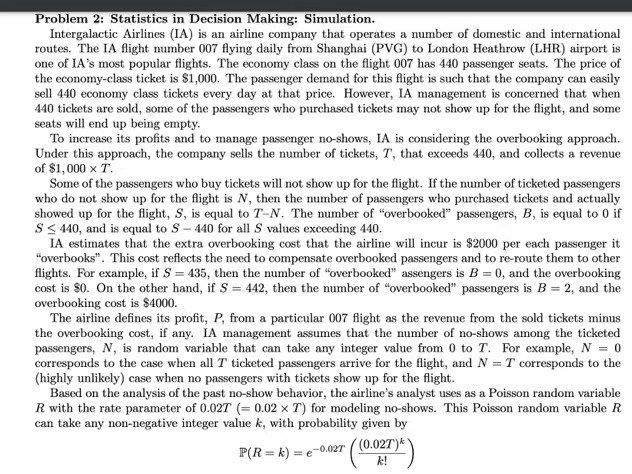
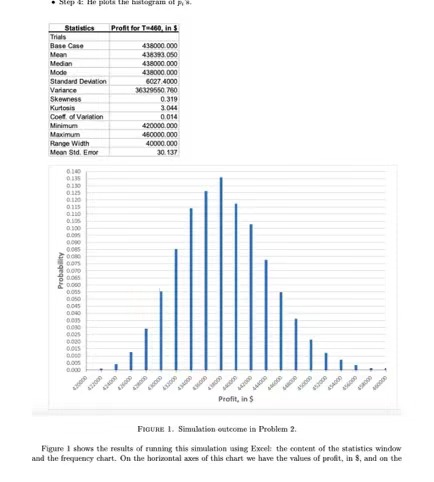
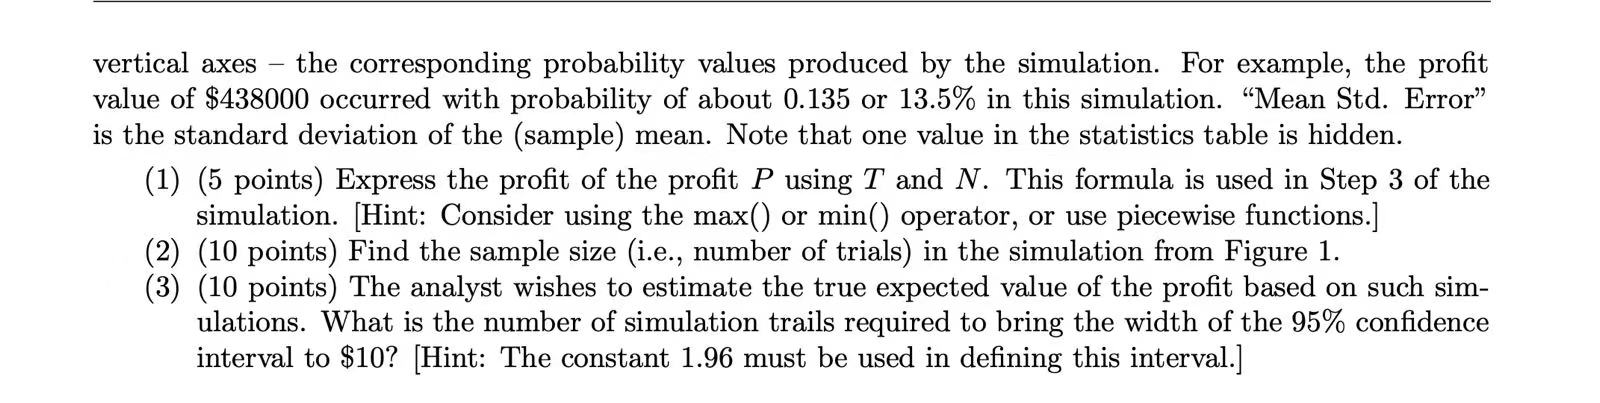
Problem 2: Statistics in Decision Making: Simulation. Intergalactic Airlines (IA) is an airline company that operates a number of domestic and international routes. The IA flight number 007 flying daily from Shanghai (PVG) to London Heathrow (LHR) airport is one of IA's most popular flights. The economy class on the flight 007 has 440 passenger seats. The price of the economy-class ticket is $1,000. The passenger demand for this flight is such that the company can easily sell 440 economy class tickets every day at that price. However, IA management is concerned that when 440 tickets are sold, some of the passengers who purchased tickets may not show up for the flight, and some seats will end up being empty. To increase its profits and to manage passenger no-shows, IA is considering the overbooking approach. Under this approach, the company sells the number of tickets, T, that exceeds 440, and collects a revenue of $1,000 x T. Some of the passengers who buy tickets will not show up for the flight. If the number of ticketed passengers who do not show up for the flight is N, then the number of passengers who purchased tickets and actually showed up for the flight, S, is equal to 7-N. The number of "overbooked" passengers, B, is equal to 0 if S 0 and 0! = 1. Using this Poisson random variable R, the analyst models the number of no-shows as / = min(R, 7) to ensure that the random values of / calculated using this formula do not exceed the number of sold tickets T. The analyst has decided to set up a simulation to model the distribution of the airline's profit P earned or a flight 007 under the policy of selling T' = 460 tickets. . Step 1: He uses computer softwares to draw i.i.d. samples of R. Denote outcome r, for each sample i. . Step 2: He then computes the corresponding no-shows for each r, in the sample, using m = min(r,, 460). . Step 3: He further computes the corresponding profit p; for each n;. [How?] . Step 4: He plots the histogram of pi's.Profit for Towind, In $ Trials Bate Case 438080 060 Median 4380807000 Mode 4360801090 Standard Deviation 4027.4000 Vanance Skewness 0.319 Kurlouis Cool of Variation 01014 Minimum 4200807000 450080.000 Hange Width 40080.020 Mean Sid. Error 30. 1:37 $3:00 Profit, in $ FIGURE 1. Simulation outcome in Problem 2. Figure 1 shows the results of running this simulation using Excel: the content of the statistics window and the frequency chart. On the horizontal axes of this chart we have the values of profit, in $, and on thevertical axes - the corresponding probability values produced by the simulation. For example, the profit value of $438000 occurred with probability of about 0.135 or 13.5% in this simulation. "Mean Std. Error" is the standard deviation of the (sample) mean. Note that one value in the statistics table is hidden. (1) (5 points) Express the profit of the profit P using T and N. This formula is used in Step 3 of the simulation. [Hint: Consider using the max() or min() operator, or use piecewise functions. (2) (10 points) Find the sample size (i.e., number of trials) in the simulation from Figure 1. (3) (10 points) The analyst wishes to estimate the true expected value of the profit based on such sim- ulations. What is the number of simulation trails required to bring the width of the 95% confidence interval to $10? Hint: The constant 1.96 must be used in defining this interval.]
Step by Step Solution
There are 3 Steps involved in it

Get step-by-step solutions from verified subject matter experts