

Question: please help me answer this topic is Identifying Regions Under Normal Curve ACTIVITY 1: LOCATE ME! Using the z-Table in Annex A, find the area
please help me answer this topic is Identifying Regions Under Normal Curve
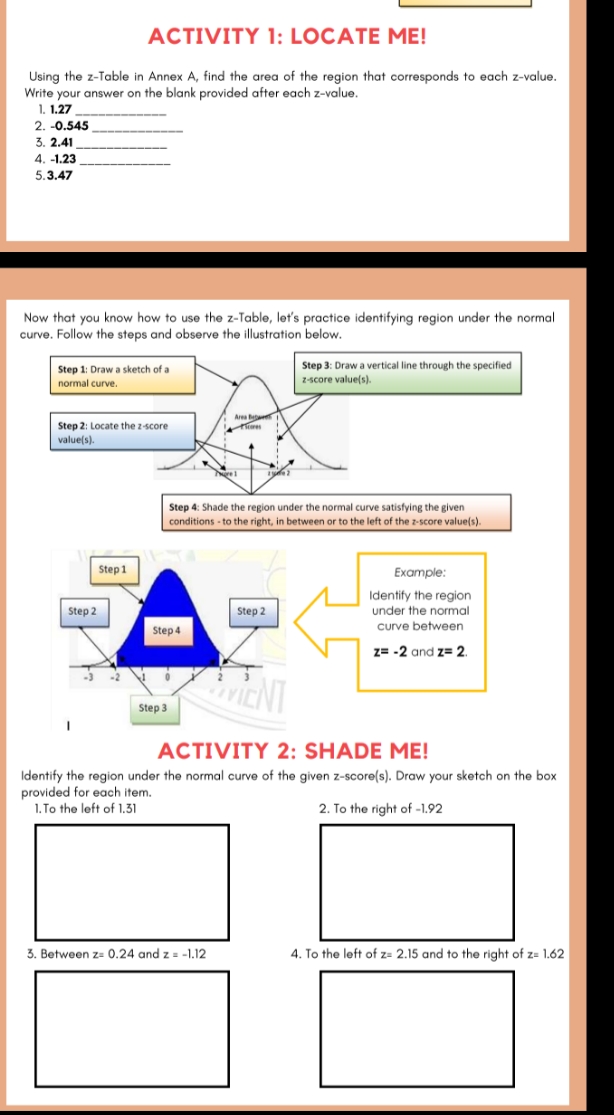
ACTIVITY 1: LOCATE ME! Using the z-Table in Annex A, find the area of the region that corresponds to each z-value. Write your answer on the blank provided after each z-value. 1. 1.27 2. -0.545 3. 2.41 4. -1.23 5.3.47 Now that you know how to use the z-Table, let's practice identifying region under the normal curve. Follow the steps and observe the illustration below. Step 1: Draw a sketch of a Step 3: Draw a vertical line through the specified normal curve. z-score value(s). Area Babe Step 2: Locate the z-score value(s). Step 4: Shade the region under the normal curve satisfying the given conditions . to the right, in between or to the left of the z-score value(s). Step 1 Example: Identify the region Step 2 Step 2 under the normal Step 4 curve between z= -2 and z= 2. Step 3 ACTIVITY 2: SHADE ME! Identify the region under the normal curve of the given z-score(s). Draw your sketch on the box provided for each item. 1. To the left of 1.31 2. To the right of -1.92 3. Between z= 0.24 and z = -1.12 4. To the left of z= 2.15 and to the right of z= 1.62
Step by Step Solution
There are 3 Steps involved in it

Get step-by-step solutions from verified subject matter experts