Question: Please help me answer/perform the following with complete solution, I am really bad at STATS : 7'. The following table shows the score of 40

Please help me answer/perform the following with complete solution, I am really bad at STATS :

Please help me answer/perform the following with complete solution, I am really
7'. The following table shows the score of 40 students in a 50-item test: 25 1 .5 3'3 29 2D a} Use the stem-and-leaf display of the above data. b} Construct a frequency distribution table showing the frequency of scores c) Construct the histogram and frequency polygon 5. Below is the frequency distribution of nal examination scores in Basic math for BSPh 1-8. Complete the table and compute for the mean, median and mode. Class Interval Frequency 50-54 1 5559 3 60~4 9 55439 1 9 ?0-?4 1 3 ?5-?9 3 80-84 2

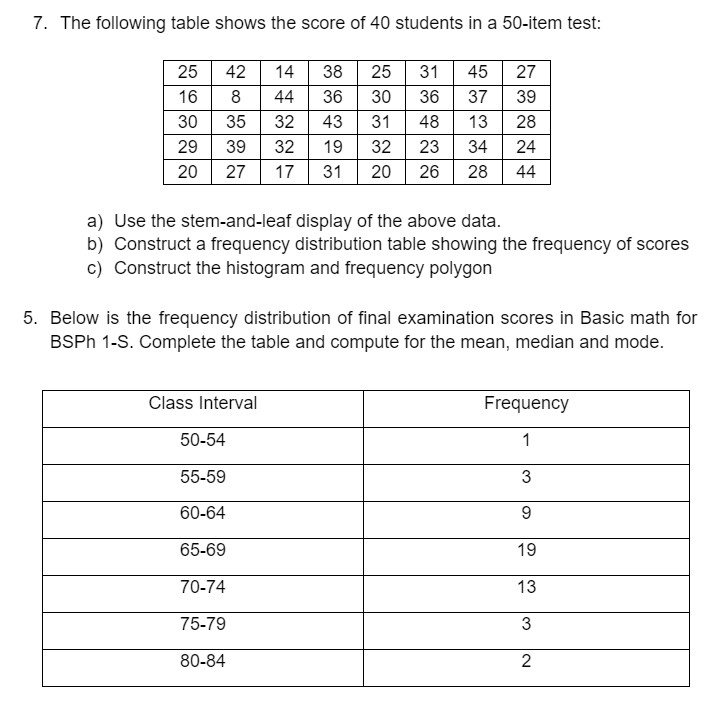
Step by Step Solution

There are 3 Steps involved in it

1 Expert Approved Answer
Step: 1 Unlock blur-text-image
Question Has Been Solved by an Expert!

Get step-by-step solutions from verified subject matter experts

Step: 2 Unlock
Step: 3 Unlock

Students Have Also Explored These Related Mathematics Questions!