

Question: Please help me asap D E Best Buy Year 2 Year 1 751 F BALANCE SHEET Cash Receivables Inventories Other Total current assets G H
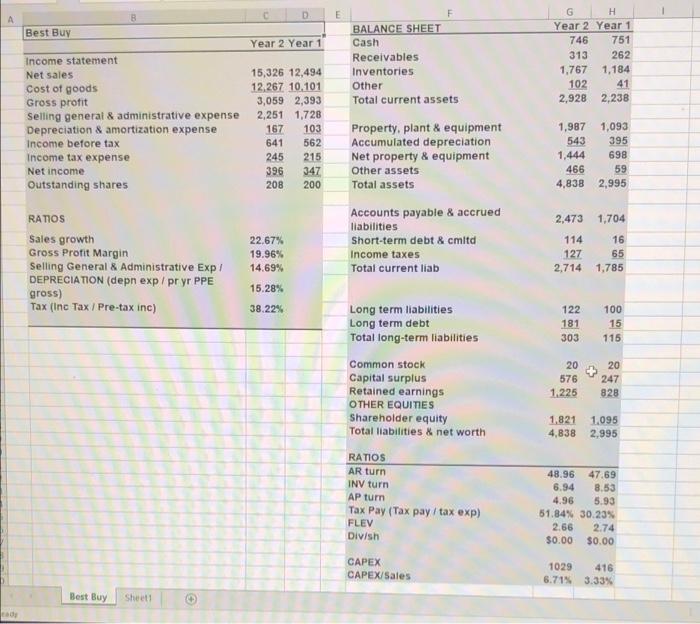
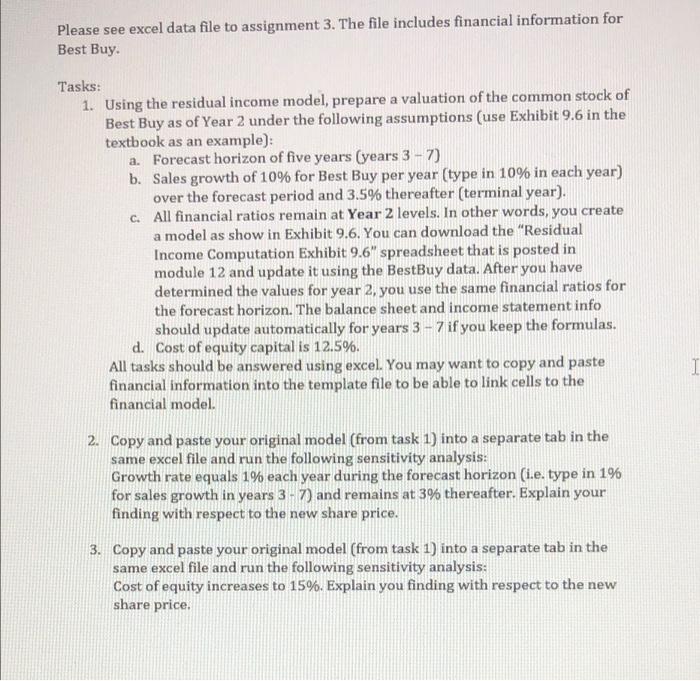
D E Best Buy Year 2 Year 1 751 F BALANCE SHEET Cash Receivables Inventories Other Total current assets G H Year 2 Year 1 746 313 262 1,767 1,184 102 41 2,928 2,238 Income statement Net sales Cost of goods Gross profit Selling general & administrative expense Depreciation & amortization expense Income before tax Income tax expense Net income Outstanding shares 15,326 12,494 12,267 10.101 3,059 2,393 2,251 1,728 167 103 641 562 245 215 396 347 208 200 1,987 543 1,444 466 4,838 1,093 395 698 59 2,995 Property, plant & equipment Accumulated depreciation Net property & equipment Other assets Total assets Accounts payable & accrued liabilities Short-term debt & cmltd Income taxes Total current liab RATIOS 2,473 1,704 Sales growth Gross Profit Margin Selling General & Administrative Exp! DEPRECIATION (depn exp/pryr PPE gross) Tax (Inc Tax / Pre-tax inc) 22.67% 19.96% 14.69% 114 127 2,714 16 65 1.785 15.28% 38.2244 Long term liabilities Long term debt Total long-term liabilities 122 181 303 100 15 115 20 576 1,225 20 247 828 Common stock Capital surplus Retained earnings OTHER EQUITIES Shareholder equity Total liabilities & net worth 1.821 4,838 1.095 2.995 RATIOS AR turn INV turn AP turn Tax Pay (Tax pay tax exp) FLEV Div/sh 48.96 47.69 6.94 8.53 4.96 5.93 51.84% 30.23% 2.66 2.74 $0.00 $0.00 CAPEX CAPEX/Sales 1029 416 6.71% 3.33% Best Buy Sheet1 Please see excel data file to assignment 3. The file includes financial information for Best Buy Tasks: 1. Using the residual income model, prepare a valuation of the common stock of Best Buy as of Year 2 under the following assumptions (use Exhibit 9.6 in the textbook as an example): a. Forecast horizon of five years (years 3 - 7) b. Sales growth of 10% for Best Buy per year (type in 10% in each year) over the forecast period and 3.5% thereafter (terminal year). C. All financial ratios remain at Year 2 levels. In other words, you create a model as show in Exhibit 9.6. You can download the "Residual Income Computation Exhibit 9.6" spreadsheet that is posted in module 12 and update it using the BestBuy data. After you have determined the values for year 2. you use the same financial ratios for the forecast horizon. The balance sheet and income statement info should update automatically for years 3 - 7 if you keep the formulas. d. Cost of equity capital is 12.5%. All tasks should be answered using excel. You may want to copy and paste financial information into the template file to be able to link cells to the financial model. I 2. Copy and paste your original model (from task 1) into a separate tab in the same excel file and run the following sensitivity analysis: Growth rate equals 1% each year during the forecast horizon (i.e. type in 1% for sales growth in years 3 - 7) and remains at 3% thereafter. Explain your finding with respect to the new share price. 3. Copy and paste your original model (from task 1) into a separate tab in the same excel file and run the following sensitivity analysis: Cost of equity increases to 15%. Explain you finding with respect to the new share price. D E Best Buy Year 2 Year 1 751 F BALANCE SHEET Cash Receivables Inventories Other Total current assets G H Year 2 Year 1 746 313 262 1,767 1,184 102 41 2,928 2,238 Income statement Net sales Cost of goods Gross profit Selling general & administrative expense Depreciation & amortization expense Income before tax Income tax expense Net income Outstanding shares 15,326 12,494 12,267 10.101 3,059 2,393 2,251 1,728 167 103 641 562 245 215 396 347 208 200 1,987 543 1,444 466 4,838 1,093 395 698 59 2,995 Property, plant & equipment Accumulated depreciation Net property & equipment Other assets Total assets Accounts payable & accrued liabilities Short-term debt & cmltd Income taxes Total current liab RATIOS 2,473 1,704 Sales growth Gross Profit Margin Selling General & Administrative Exp! DEPRECIATION (depn exp/pryr PPE gross) Tax (Inc Tax / Pre-tax inc) 22.67% 19.96% 14.69% 114 127 2,714 16 65 1.785 15.28% 38.2244 Long term liabilities Long term debt Total long-term liabilities 122 181 303 100 15 115 20 576 1,225 20 247 828 Common stock Capital surplus Retained earnings OTHER EQUITIES Shareholder equity Total liabilities & net worth 1.821 4,838 1.095 2.995 RATIOS AR turn INV turn AP turn Tax Pay (Tax pay tax exp) FLEV Div/sh 48.96 47.69 6.94 8.53 4.96 5.93 51.84% 30.23% 2.66 2.74 $0.00 $0.00 CAPEX CAPEX/Sales 1029 416 6.71% 3.33% Best Buy Sheet1 Please see excel data file to assignment 3. The file includes financial information for Best Buy Tasks: 1. Using the residual income model, prepare a valuation of the common stock of Best Buy as of Year 2 under the following assumptions (use Exhibit 9.6 in the textbook as an example): a. Forecast horizon of five years (years 3 - 7) b. Sales growth of 10% for Best Buy per year (type in 10% in each year) over the forecast period and 3.5% thereafter (terminal year). C. All financial ratios remain at Year 2 levels. In other words, you create a model as show in Exhibit 9.6. You can download the "Residual Income Computation Exhibit 9.6" spreadsheet that is posted in module 12 and update it using the BestBuy data. After you have determined the values for year 2. you use the same financial ratios for the forecast horizon. The balance sheet and income statement info should update automatically for years 3 - 7 if you keep the formulas. d. Cost of equity capital is 12.5%. All tasks should be answered using excel. You may want to copy and paste financial information into the template file to be able to link cells to the financial model. I 2. Copy and paste your original model (from task 1) into a separate tab in the same excel file and run the following sensitivity analysis: Growth rate equals 1% each year during the forecast horizon (i.e. type in 1% for sales growth in years 3 - 7) and remains at 3% thereafter. Explain your finding with respect to the new share price. 3. Copy and paste your original model (from task 1) into a separate tab in the same excel file and run the following sensitivity analysis: Cost of equity increases to 15%. Explain you finding with respect to the new share price
Step by Step Solution
There are 3 Steps involved in it

Get step-by-step solutions from verified subject matter experts