

Question: please help me ASAP Problem 13-2A Part 2 2. Complete the below table to calculate income statement data in common-size percents. (Round your percentage answers
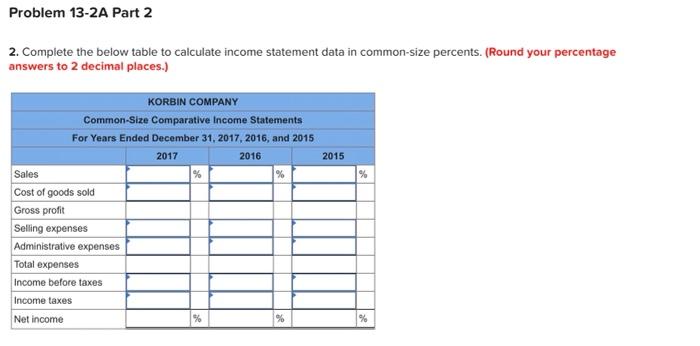
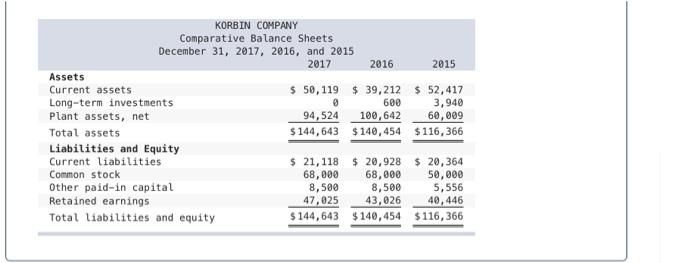
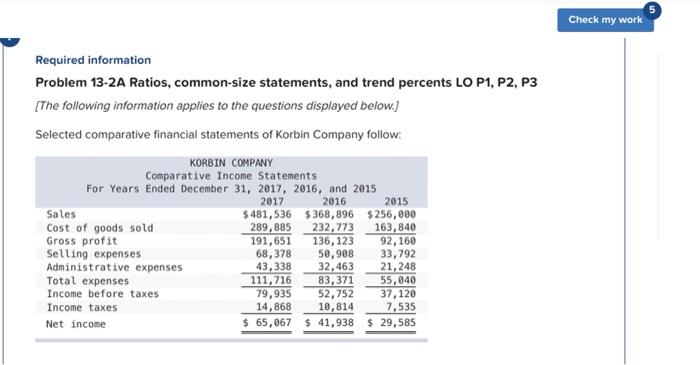
Problem 13-2A Part 2 2. Complete the below table to calculate income statement data in common-size percents. (Round your percentage answers to 2 decimal places.) 2015 % KORBIN COMPANY Common-Size Comparative Income Statements For Years Ended December 31, 2017, 2016, and 2015 2017 2016 Sales % % Cost of goods sold Gross profit Selling expenses Administrative expenses Total expenses Income before taxes Income taxes Net income KORBIN COMPANY Comparative Balance Sheets December 31, 2017, 2016, and 2015 2017 2016 2015 Assets Current assets $ 50,119 $ 39,212 $ 52,417 Long-term investments 600 3,940 Plant assets, net 94,524 100,642 60,009 Total assets $ 144,643 $ 140,454 $116,366 Liabilities and Equity Current liabilities $ 21,118 $ 20,928 $ 20,364 Common stock 68,000 68,000 50,000 Other paid-in capital 8,599 8,500 5,556 Retained earnings 47,025 43,026 40, 446 Total liabilities and equity $ 144,643 $140,454 $116,366 Check my work Required information Problem 13-2A Ratios, common-size statements, and trend percents LO P1, P2, P3 [The following information applies to the questions displayed below.) Selected comparative financial statements of Korbin Company follow: KORBIN COMPANY Comparative Income Statements For Years Ended December 31, 2017, 2016, and 2015 2017 2016 2015 Sales $ 481,536 $368,896 $256,000 Cost of goods sold 289,885 232,773 163,840 Gross profit 191,651 136, 123 92,160 Selling expenses 68,378 50,908 33,792 Administrative expenses 43, 338 32,463 21,248 Total expenses 111,716 83,371 55, 040 Income before taxes 79,935 52,752 37, 120 Income taxes 14,868 10,814 7,535 Net income $ 65,067 $ 41,938 $ 29,585
Step by Step Solution
There are 3 Steps involved in it

Get step-by-step solutions from verified subject matter experts