

Question: Please help me Based on the given dataset: Q1. What are the Upper and lower Control Limits in your X-Chart? (p. 251) Show your work
Please help me
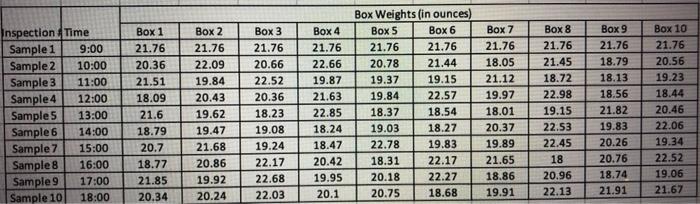
Based on the given dataset: Q1. What are the Upper and lower Control Limits in your X-Chart? (p. 251) Show your work and calculations. Assume that the population standard deviation (8) is NOT known. (2 pts) Q2. What are the Upper and Lower Control Limits in your R-Chart? (p.253) Show your work and calculations. (2 pts) Q3. Is the process under control? Why? Why not? (1 pts) Q4. If the design specifications are 20 + 1 ounces, calculate the Process Capability Ratio (Cp)and Process Capability Index (Cpk). (2 pts) Inspection Time Sample 1 9:00 Sample 2 10:00 Sample 3 11:00 Sample 4 12:00 Sample 5 13:00 Sample 6 14:00 Sample 7 15:00 Sample 8 16:00 Sample 9 17:00 Sample 10 18:00 Box 1 21.76 20.36 21.51 18.09 21.6 18.79 20.7 18.77 21.85 20.34 Box 2 21.76 22.09 19.84 20.43 19.62 19.47 21.68 20.86 19.92 20.24 Box 3 21.76 20.66 22.52 20.36 18.23 19.08 19.24 22.17 22.68 22.03 Box 4 21.76 22.66 19.87 21.63 22.85 18.24 18.47 20.42 19.95 20.1 Box Weights (in ounces) Box S Box 6 21.76 21.76 20.78 21.44 19.37 19.15 19.84 22.57 18.37 18.54 19.03 18.27 22.78 19.83 18.31 22.17 20.18 22.27 20.75 18.68 Box 7 21.76 18.05 21.12 19.97 18.01 20.37 19.89 21.65 18.86 19.91 Box 8 21.76 21.45 18.72 22.98 19.15 22.53 22.45 18 20.96 22.13 Box 9 21.76 18.79 18.13 18.56 21.82 19.83 20.26 20.76 18.74 21.91 Box 10 21.76 20.56 19.23 18.44 20.46 22.06 19.34 22.52 19.06 21.67 Step by Step Solution
There are 3 Steps involved in it
1 Expert Approved Answer
Step: 1 Unlock

Question Has Been Solved by an Expert!
Get step-by-step solutions from verified subject matter experts
Step: 2 Unlock
Step: 3 Unlock