

Question: Please help me better understand this !! Test: Practice Final Exam Question 19 of 25 This test: 25 point(s) possible Submit test This question: 1
Please help me better understand this !!
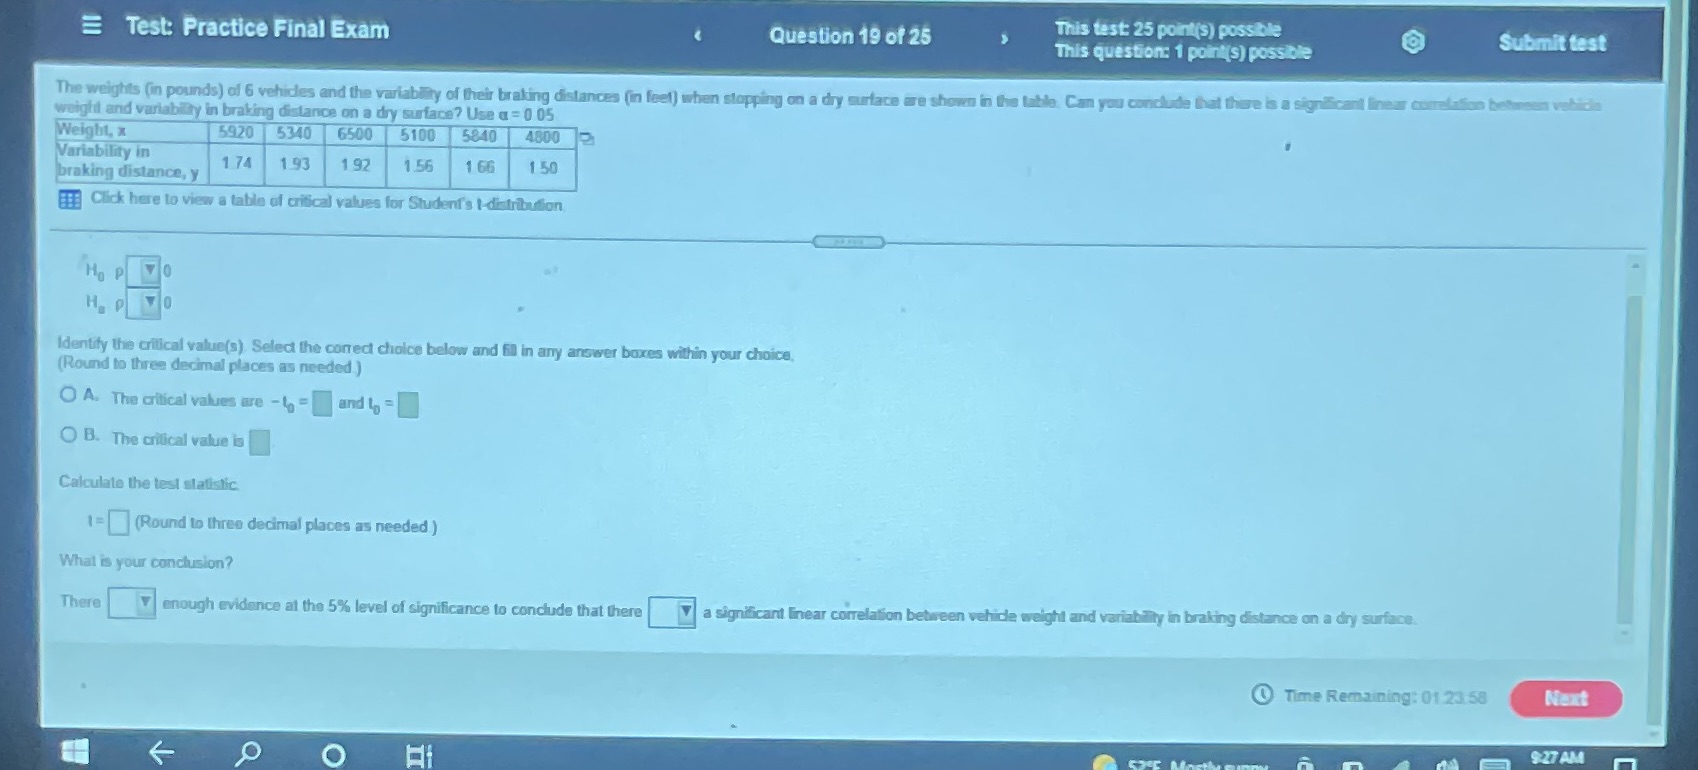
Test: Practice Final Exam Question 19 of 25 This test: 25 point(s) possible Submit test This question: 1 point(s) possible The weights (in pounds) of 6 vehicles and the variability of their braking distances (in feel) when stopping on a dry surface are shown in the table. Can you conclude that there is a sign weight and variability in braking distance on a dry surface? Use a = 0 05 Weight, x 5920 5340 6500 5100 5840 4800 Variability in braking distance, y 1 74 193 1 92 1.56 1 66 1 50 Click here to view a table of critical values for Student's |-distribution Ho P Hap Vo Identify the critical value(s) Select the correct choice below and fill in any answer boxes within your choice, (Round to three decimal places as needed ) O A. The critical values are - b = and to = O B. The critical value is Calculate the test statistic. 1= (Round to three decimal places as needed ) What is your conclusion? There enough evidence at the 5% level of significance to conclude that there a significant linear correlation between vehicle weight and variability in braking distance on a dry surface. Time Remaining: 01.23:58 Next 9:27 AM O
Step by Step Solution
There are 3 Steps involved in it

Get step-by-step solutions from verified subject matter experts