

Question: Please help me Build a graph based on the data table that I built. Which type of graph should I use and which data (C
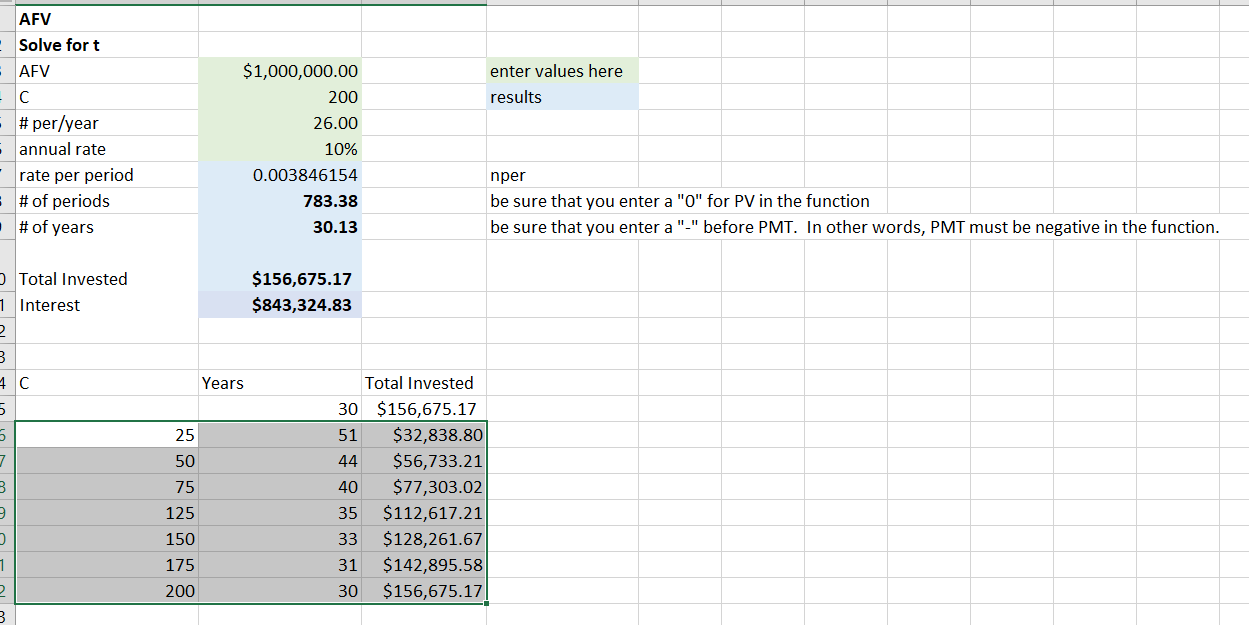
Please help me Build a graph based on the data table that I built. Which type of graph should I use and which data (C ,Years and Total invest) should be on which Axis to show how changes in C impact time until goal and the total invested.?
Step by Step Solution
There are 3 Steps involved in it
1 Expert Approved Answer
Step: 1 Unlock

Question Has Been Solved by an Expert!
Get step-by-step solutions from verified subject matter experts
Step: 2 Unlock
Step: 3 Unlock